Open Access
Fig. 5
Download original image
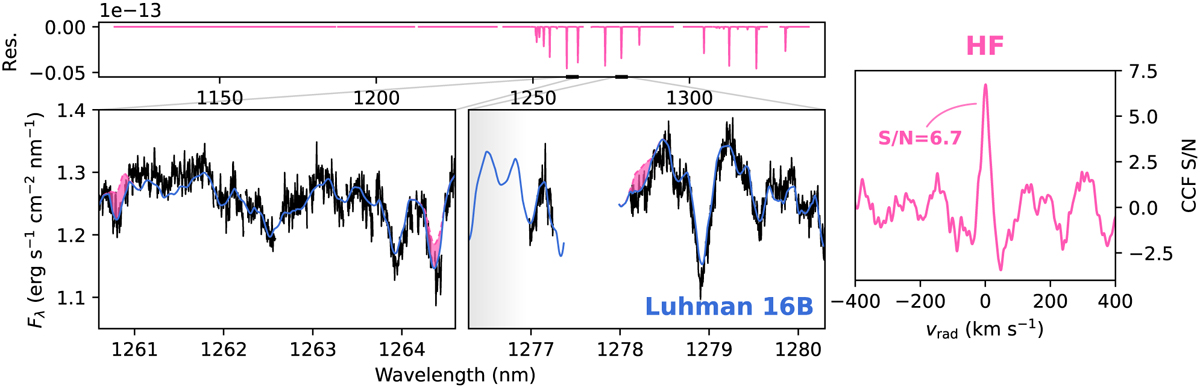
Detection analysis of HF in the Luhman 16B spectrum. The left panels show the spectral contribution of HF by comparing the complete model (solid blue line) to a model without HF (dashed pink line). The residuals show the difference between these two models. The right panel presents the CCF described in Sect. 3.1.
Current usage metrics show cumulative count of Article Views (full-text article views including HTML views, PDF and ePub downloads, according to the available data) and Abstracts Views on Vision4Press platform.
Data correspond to usage on the plateform after 2015. The current usage metrics is available 48-96 hours after online publication and is updated daily on week days.
Initial download of the metrics may take a while.