Fig. 4
Download original image
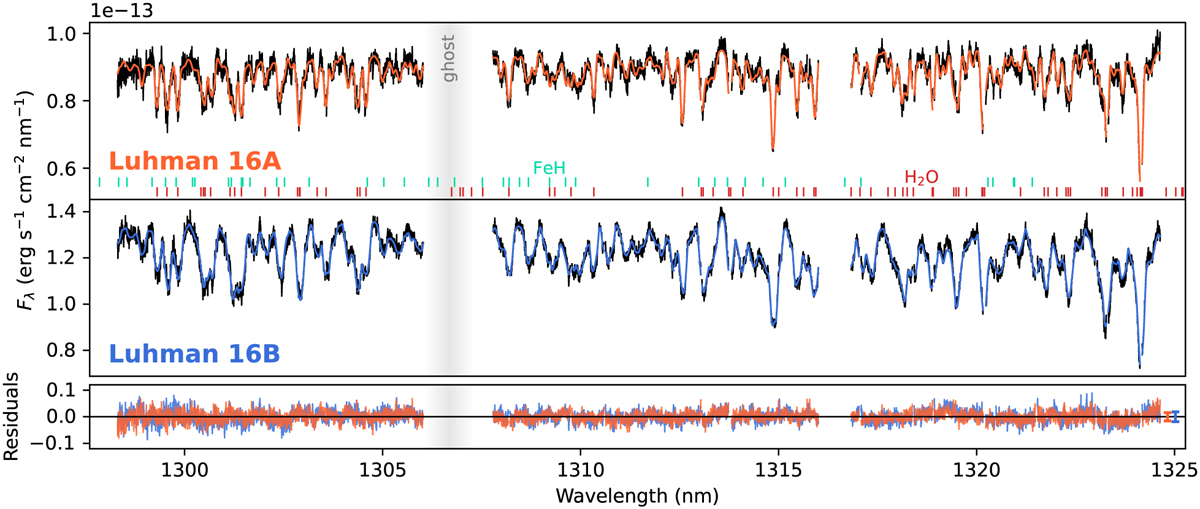
Best-fitting models to the J-band spectra of Luhman 16. The observations are shown in black, while the fiducial models are shown in orange and blue for Luhman 16A and B, respectively. The mean scaled uncertainties, defined as diag (![]() ), are displayed to the right of the residuals for reference. The predominant absorption lines of FeH and H2O are indicated in the upper panel. The fits to the other spectral orders can be found in Appendix C.
), are displayed to the right of the residuals for reference. The predominant absorption lines of FeH and H2O are indicated in the upper panel. The fits to the other spectral orders can be found in Appendix C.
Current usage metrics show cumulative count of Article Views (full-text article views including HTML views, PDF and ePub downloads, according to the available data) and Abstracts Views on Vision4Press platform.
Data correspond to usage on the plateform after 2015. The current usage metrics is available 48-96 hours after online publication and is updated daily on week days.
Initial download of the metrics may take a while.