Fig. 9.
Download original image
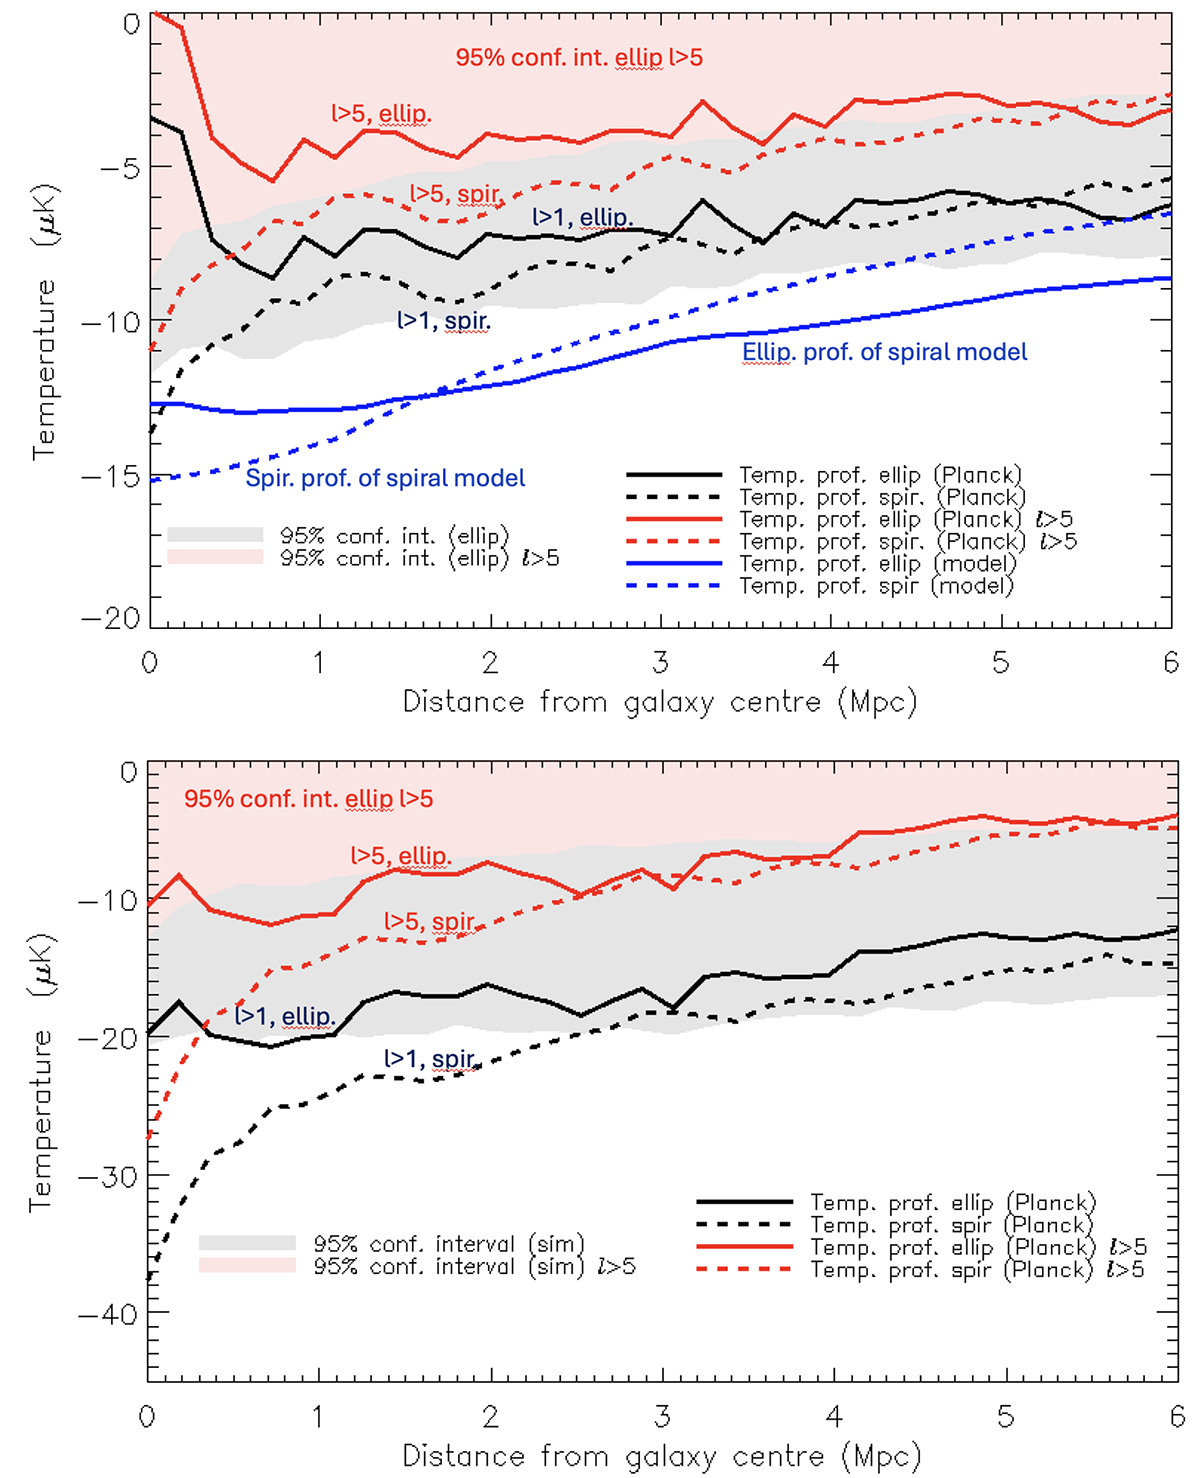
Same plots as in Fig. 2, but now for elliptical galaxies (shaded areas and solid lines). The results for late type spiral galaxies from Fig. 2 are present as dashed lines. Upper plot is the profile taken over galaxies in the full map, lower plot for galaxies within the 3 regions A, B, and C only. The blue lines in the upper figure show the profiles calculated on the foreground model map of H2023 (shown in Fig. 4) where only late type spiral galaxies are assigned a synthetic profile. The solid blue line shows the profile taken around elliptical galaxies in this model whereas the dashed blue line shows the profile taken around late type spiral galaxies.
Current usage metrics show cumulative count of Article Views (full-text article views including HTML views, PDF and ePub downloads, according to the available data) and Abstracts Views on Vision4Press platform.
Data correspond to usage on the plateform after 2015. The current usage metrics is available 48-96 hours after online publication and is updated daily on week days.
Initial download of the metrics may take a while.