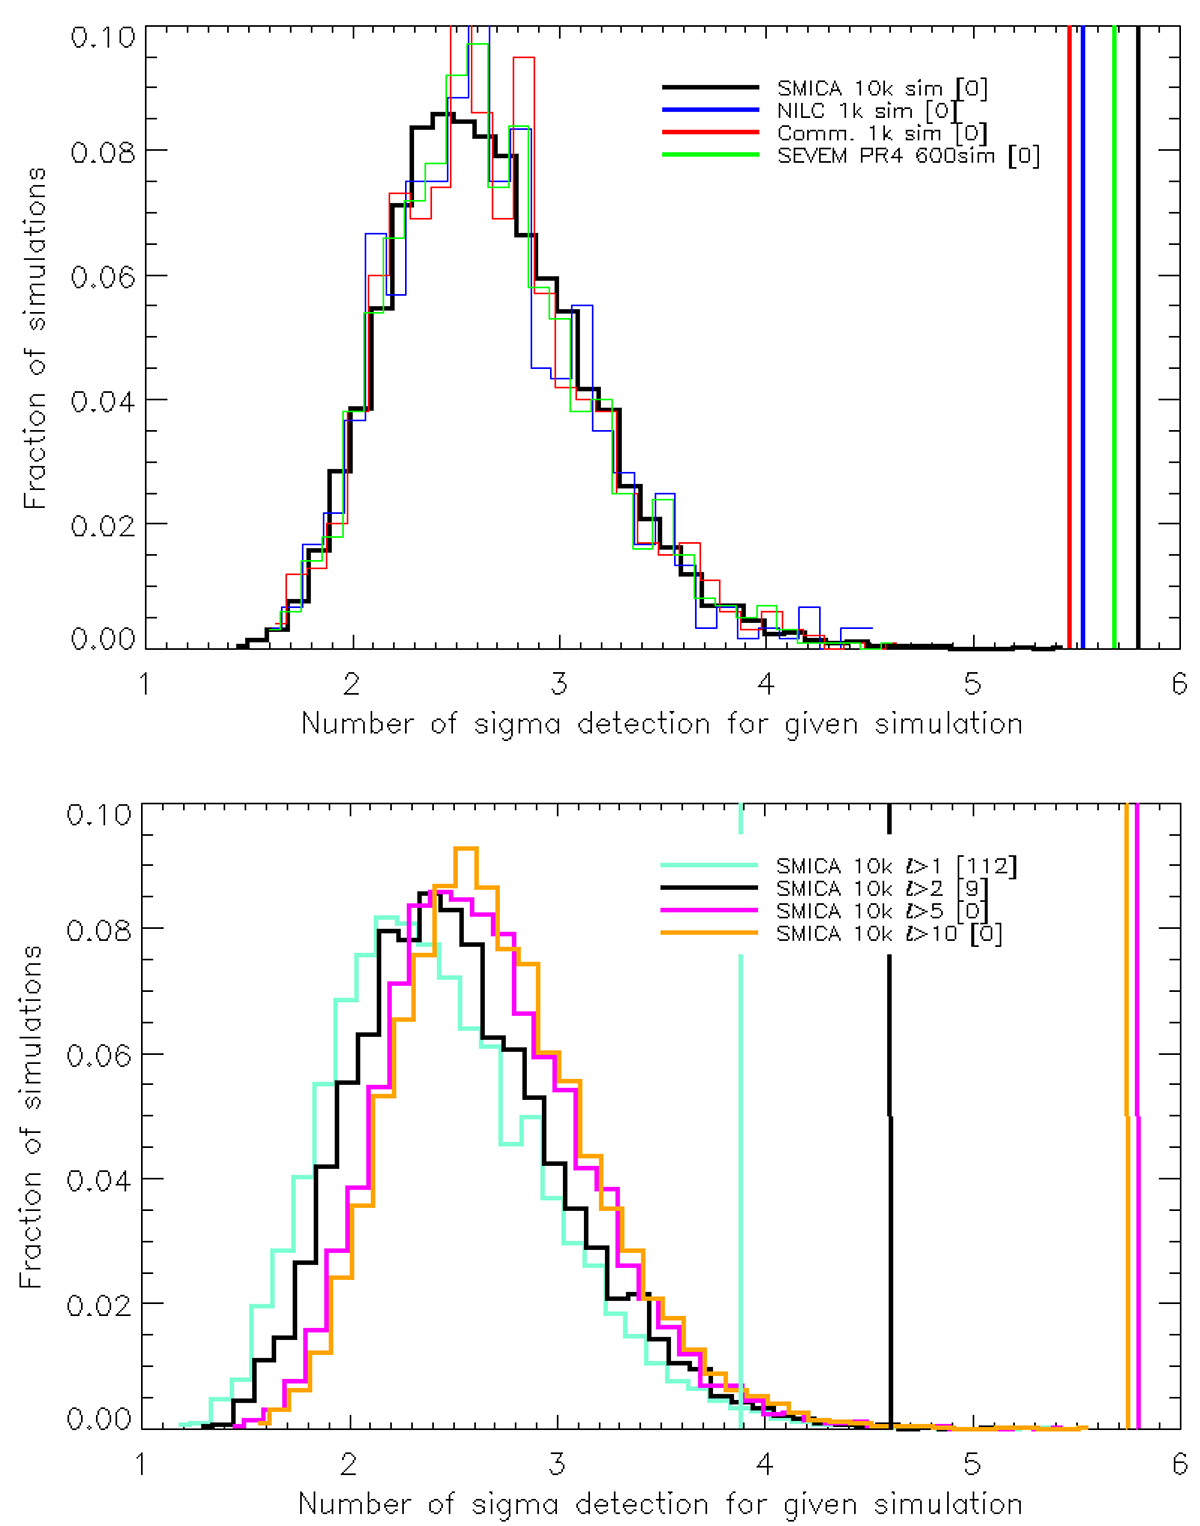
Fig. 6.
Download original image
As in Fig. 3, we show the distribution of the first temperature profile bin for galaxies in massive filaments, but now measured in the number of σ deviations from the mean temperature value. For each simulated CMB map, the temperature of the first profile bin is calculated for all galaxy samples with the combinations of maximum redshifts up to z < 0.25 in steps of Δz = 0.01 and all possible minimum sizes in steps of 0.5 kpc, early, late spirals, or elliptical galaxies and galaxies outside or inside dense galaxy filaments. The sample of galaxies with the combination of maximum redshift, minimum galaxy size, galaxy type and inside or outside filaments that maximizes the deviation (positive or negative deviation) from the mean profile depth for each given simulation is used and the corresponding deviation plotted in the histogram. The vertical lines show the deviations obtained in the same manner for the Planck data. Upper plot: Results for maps with multipoles ℓ ≤ 5 removed for different foreground subtraction methods and the lower plot shows only SMICA results for the four cases: only mono- and dipole removed, quadrupole removed, ℓ ≤ 5 removed and ℓ ≤ 10 removed. The number in brackets show the number of simulations with a higher deviation than the data.
Current usage metrics show cumulative count of Article Views (full-text article views including HTML views, PDF and ePub downloads, according to the available data) and Abstracts Views on Vision4Press platform.
Data correspond to usage on the plateform after 2015. The current usage metrics is available 48-96 hours after online publication and is updated daily on week days.
Initial download of the metrics may take a while.