Fig. 5.
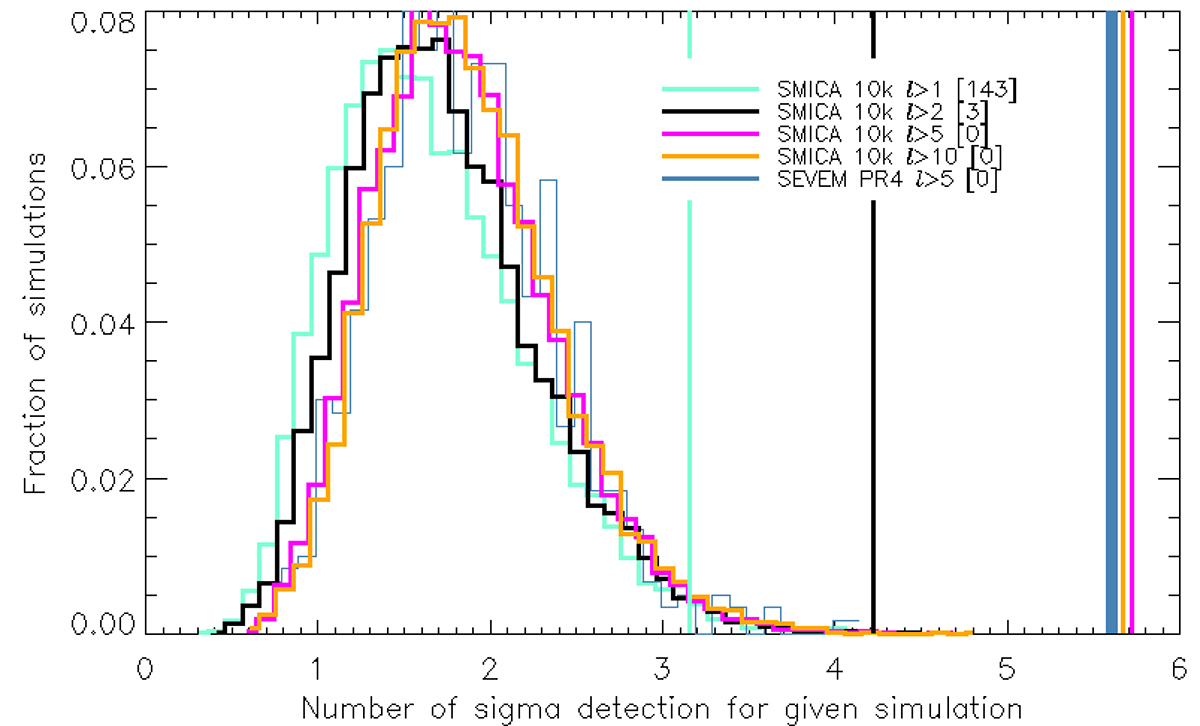
Download original image
As in Fig. 3, we show the distribution of the first temperature profile bin, but now measured in the number of σ deviations from the mean temperature value. For each simulated CMB map, the temperature of the first profile bin is calculated for the combinations of the samples of smallest/largest galaxies, early or late spirals or elliptical galaxies, and galaxies outside or inside dense galaxy filaments. Of these combinations, the value of the combination which maximises the absolute value deviation from the mean profile for each given simulation is plotted in the histogram. The vertical lines show the deviations obtained in the same manner for the Planck data. The case SMICA with 10 000 simulations for the four cases: only mono- and dipole removed, quadrupole removed, ℓ ≤ 5 removed and ℓ ≤ 10 removed are shown as well as SEVEM PR4 with ℓ ≤ 5 removed. The number in brackets show the number of simulations with a higher deviation than the data.
Current usage metrics show cumulative count of Article Views (full-text article views including HTML views, PDF and ePub downloads, according to the available data) and Abstracts Views on Vision4Press platform.
Data correspond to usage on the plateform after 2015. The current usage metrics is available 48-96 hours after online publication and is updated daily on week days.
Initial download of the metrics may take a while.