Fig. 3.
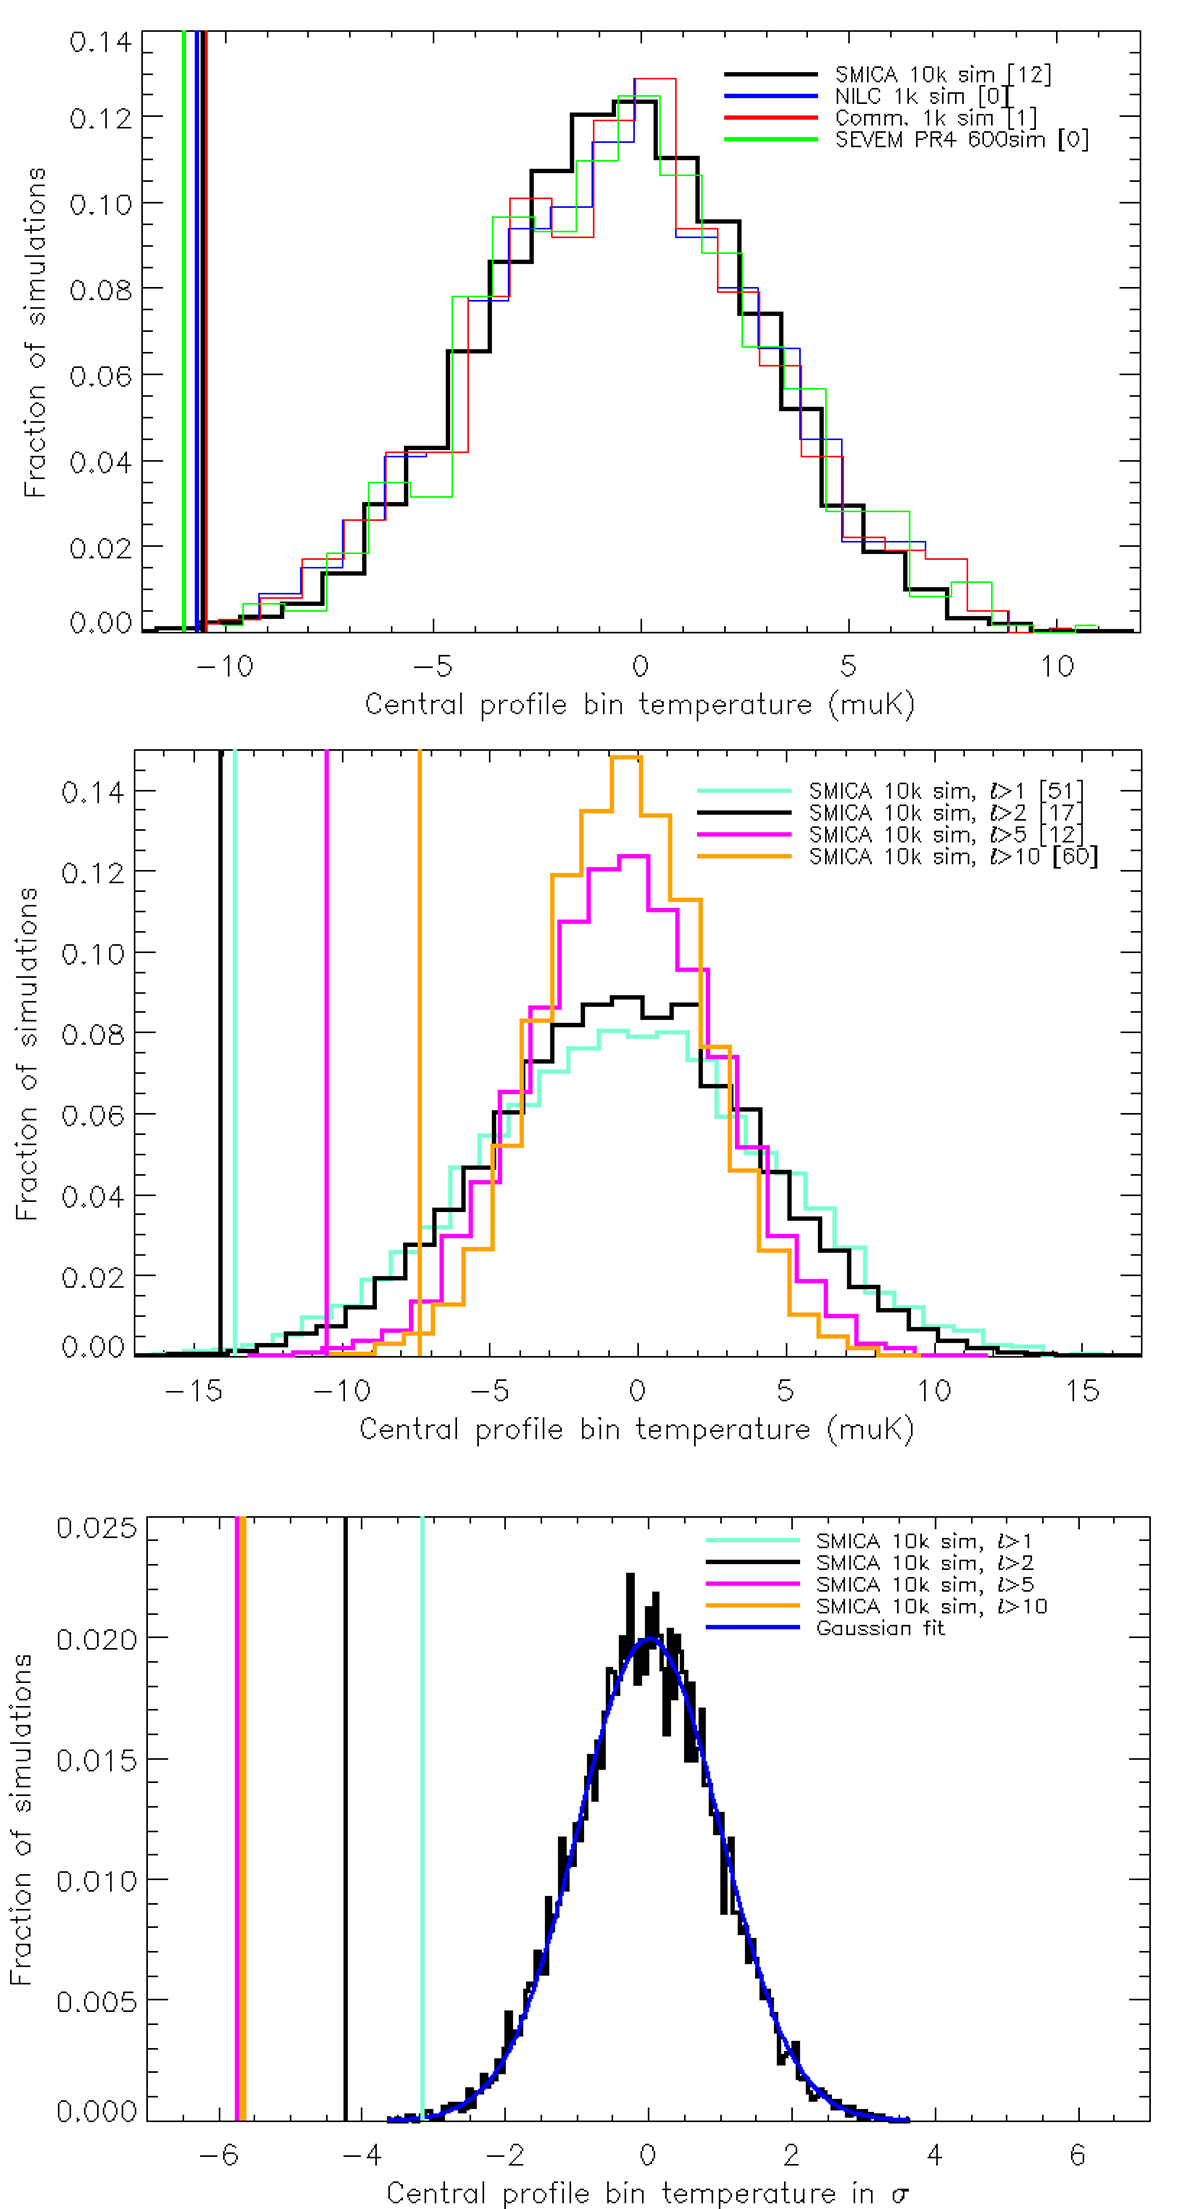
Download original image
Distribution of the first temperature profile bin of Fig. 2 calculated on simulated maps. Upper plot: ℓ > 5 case for SEVEM PR4 (corresponds to the first bin of the red line in Fig. 2), shown as a green vertical line. The green histogram shows the distribution of this first bin from simulations (corresponding to the first bin of the red shaded area in Fig. 2). The corresponding results for the other three Planck foreground subtraction methods (from the Planck PR3 release), SMICA (10 000 simulations), NILC (1000 simulations), and Commander (1000 simulations) are also shown. Middle plot: Same results for SMICA (10 000 simulations) only for the four cases: only mono and dipole removed, quadrupole removed, ℓ ≤ 5 removed, and ℓ ≤ 10 removed. Lower plot: Same as in the middle plot, but for galaxies in dense environments only (defined by the circles in Fig. 4) and with the x-axis in units of standard deviations of the Gaussian fit to the histogram for the l > 2 case shown as a blue line. In the upper two plots, the number of simulations with a smaller profile depth than the data is shown in brackets.
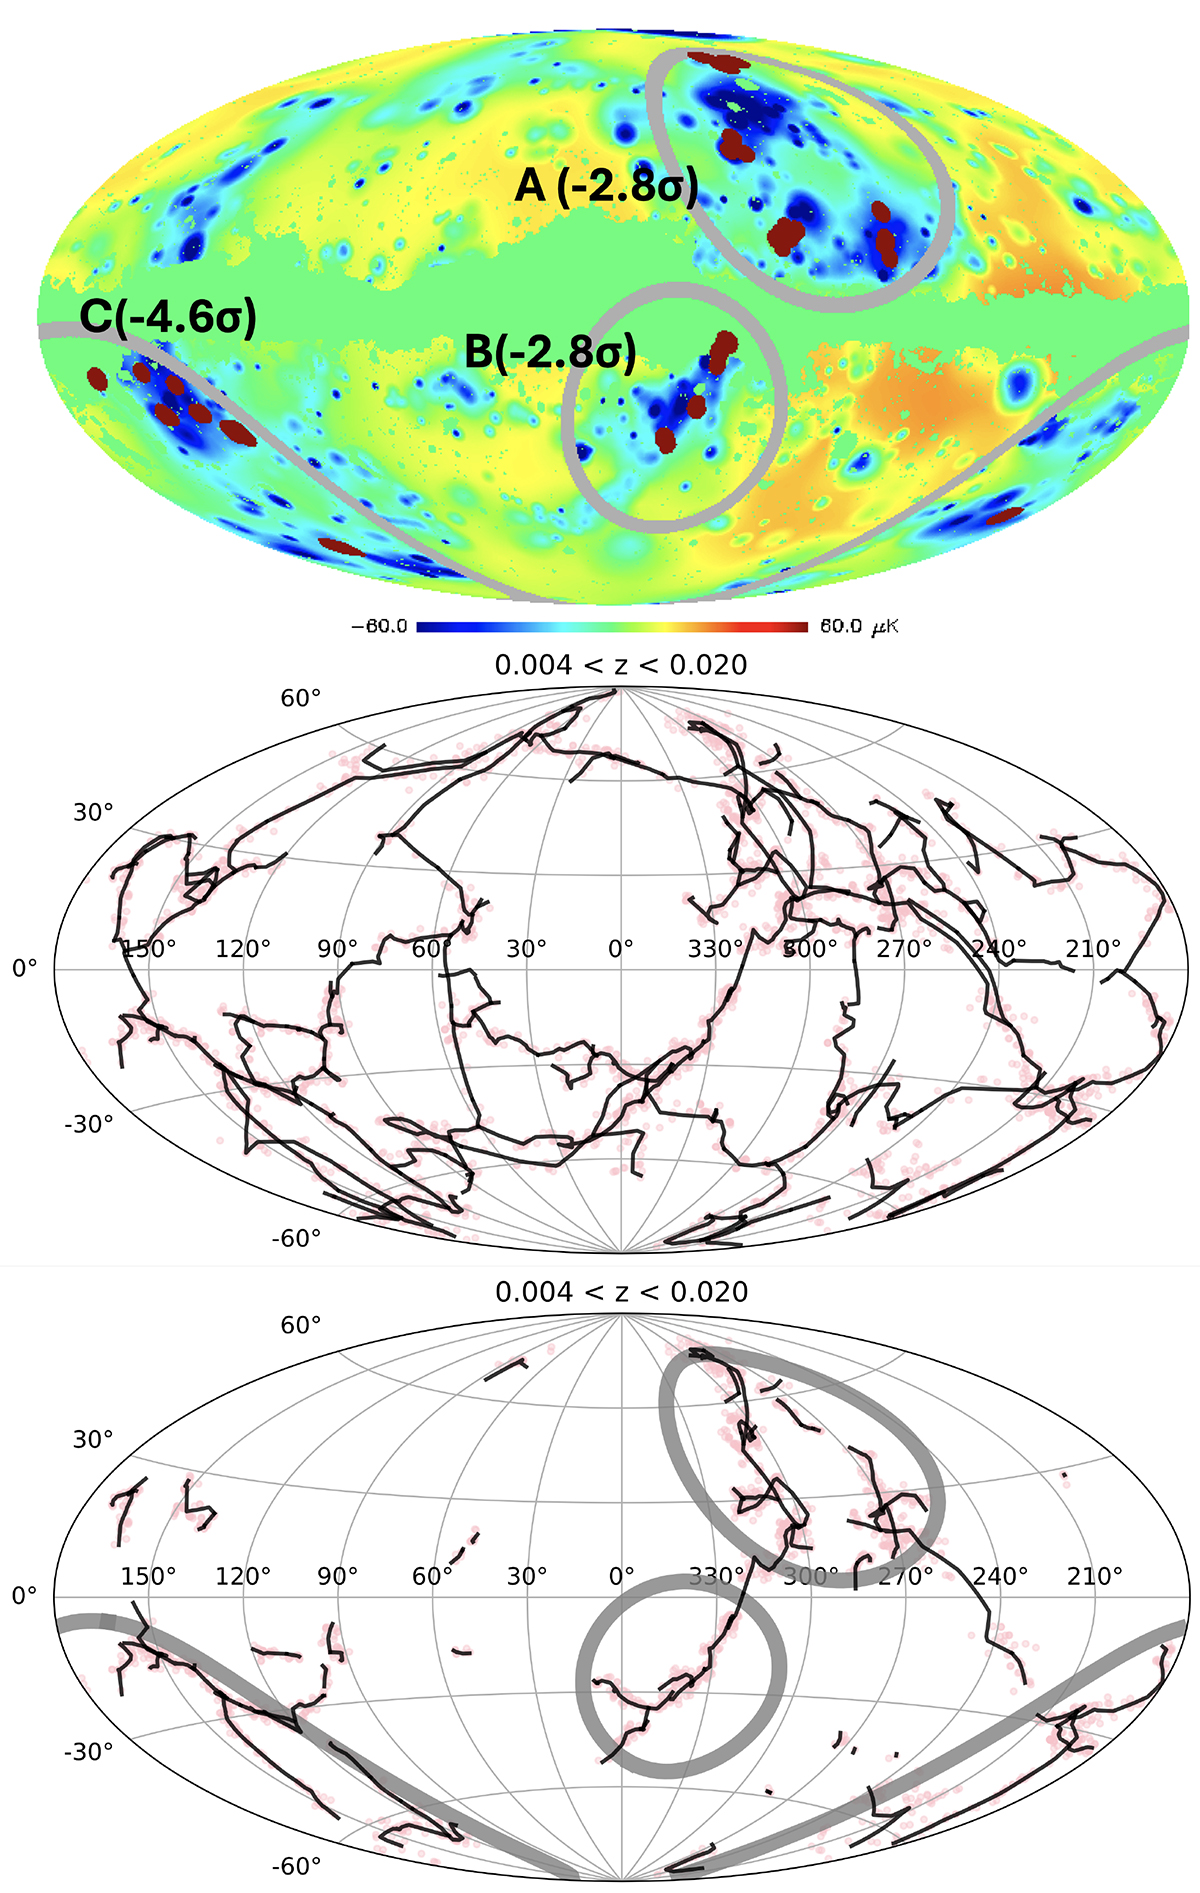
Fig. 4.
Three circular areas around the extended filaments with the highest galaxy density, denoted area A, B, and C. Upper plot: Map showing the galaxy foreground temperature model from H2023. The model shows high galaxy density of nearby (z < 0.017) galaxies as low temperature. Red dots show the positions of massive (> 1013 M⊙) galaxy groups containing large spiral galaxies within z < 0.02. The significance of the profile depth in Planck SMICA maps with ℓ ≤ 5 removed for spiral galaxies within the given zone is quoted in standard deviations calibrated on 10 000 simulations. Middle and lower plot: Projected distribution of filaments for the redshift range z ∈ [0.004, 0.02] for both the total sample (middle panel) and the highest linear K-band luminosity density (lower panel). The dotted pink lines represent 2MRS galaxies with a perpendicular distance of less than 4 Mpc to the filaments.

Current usage metrics show cumulative count of Article Views (full-text article views including HTML views, PDF and ePub downloads, according to the available data) and Abstracts Views on Vision4Press platform.
Data correspond to usage on the plateform after 2015. The current usage metrics is available 48-96 hours after online publication and is updated daily on week days.
Initial download of the metrics may take a while.