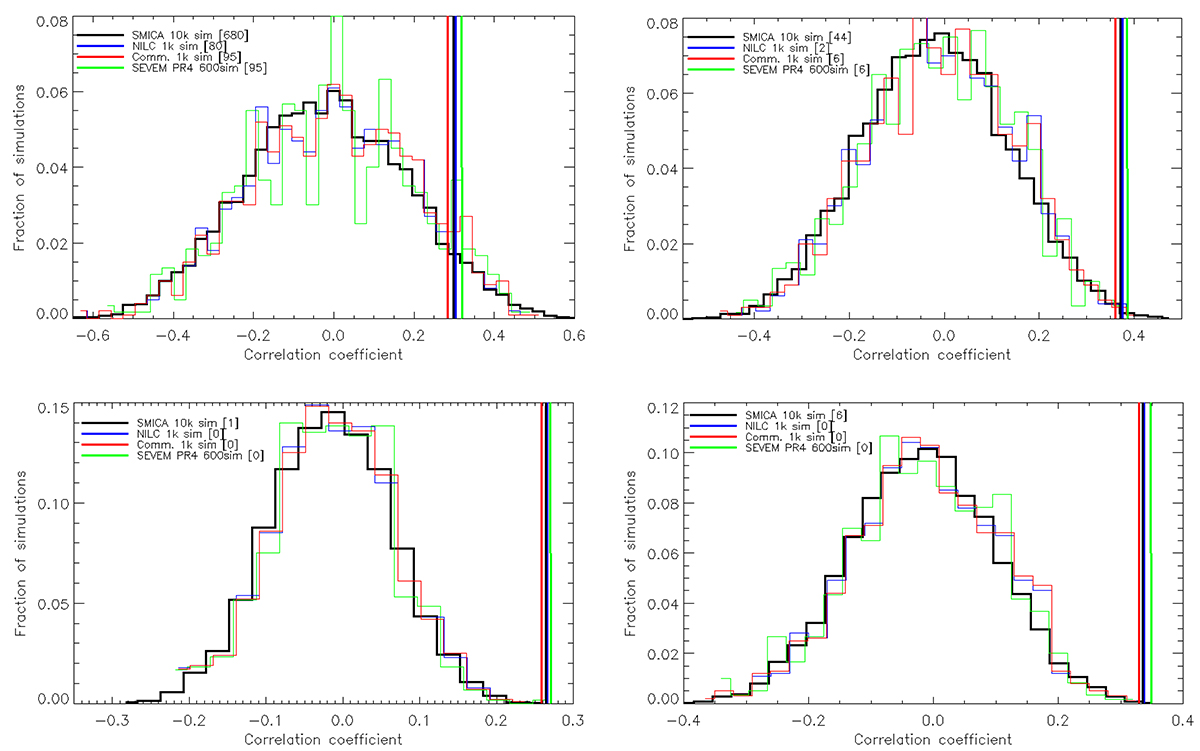
Fig. 10.
Download original image
Correlation coefficients between CMB maps and the galaxy distribution map for low multipoles. Histogram shows correlation coefficients between the galaxy distribution map and simulated CMB maps, vertical line shows the same using the Planck CMB map. Clockwise from the upper left plot we show the correlation results with upper multipoles ℓmax = 5, ℓmax = 7, ℓmax = 10 and ℓmax = 16. The number in brackets show the number of simulations with a higher correlation coefficient than the data.
Current usage metrics show cumulative count of Article Views (full-text article views including HTML views, PDF and ePub downloads, according to the available data) and Abstracts Views on Vision4Press platform.
Data correspond to usage on the plateform after 2015. The current usage metrics is available 48-96 hours after online publication and is updated daily on week days.
Initial download of the metrics may take a while.