Fig. 8.
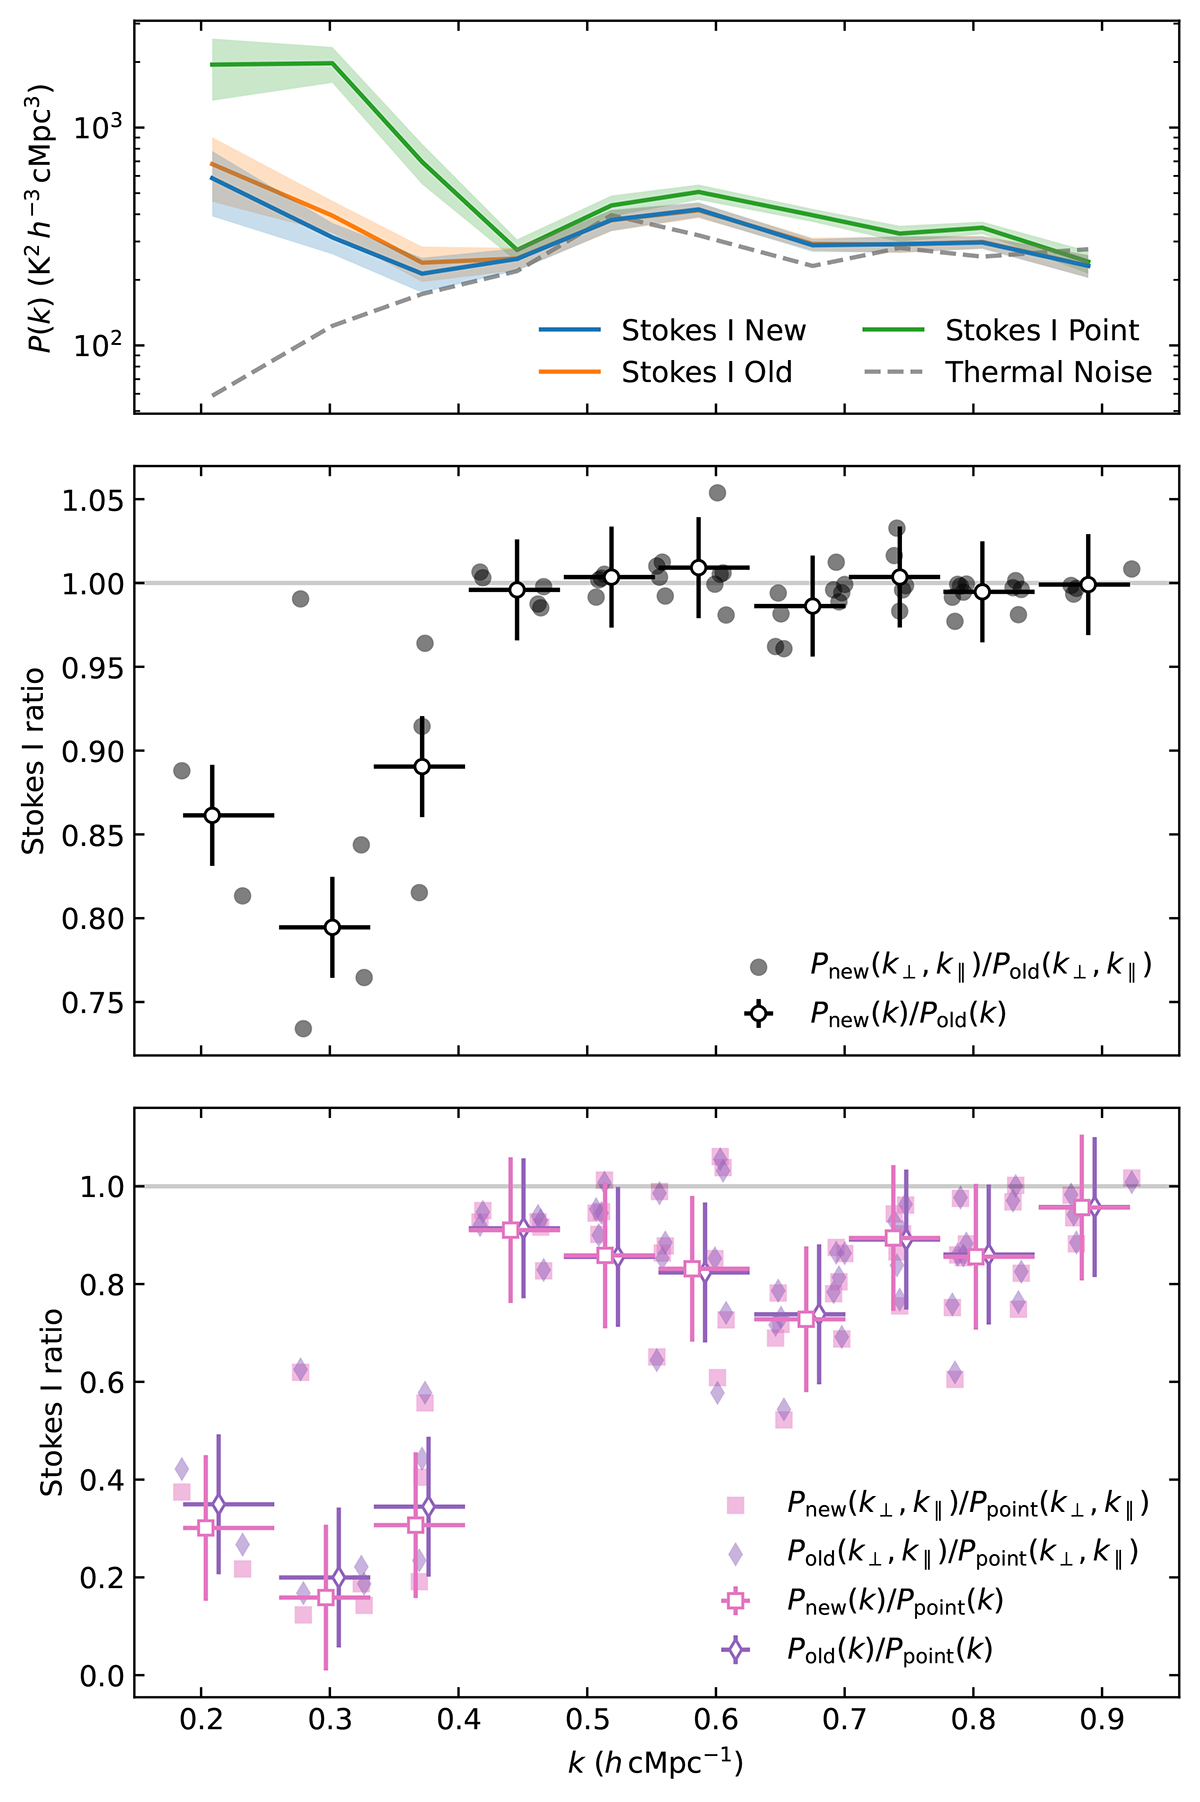
Download original image
Power spectra along the Cyg A direction after DD subtraction (top panel) and their ratios (middle and bottom panels) for the simulated NCP dataset. The top panel shows Stokes IP(k) after the DD subtraction step using the new (blue), old (orange), and point source (green) models, along with the thermal noise level (dashed grey line). The shaded areas represent the 1σ uncertainties. The middle panel shows the ratio New/Old (black dots), while the bottom panel shows the ratios New/Point (pink squares), and Old/Point (purple diamonds). Filled markers represent the ratio of the cylindrical power spectra P(k⊥, k∥) for each (k⊥, k∥)-cell within the Cyg A delay lines, while the white-faced markers indicate the ratios of the power spectra P(k). For the latter, the horizontal error bars indicate the k-bin extension, while the vertical error bars indicate the 1σ standard deviation over all (k⊥, k∥)-cells of the ratios shown in Fig. 7. A small offset in k has been added to the white-faced pink squares and purple diamonds in the bottom panel to avoid overlapping of error bars.
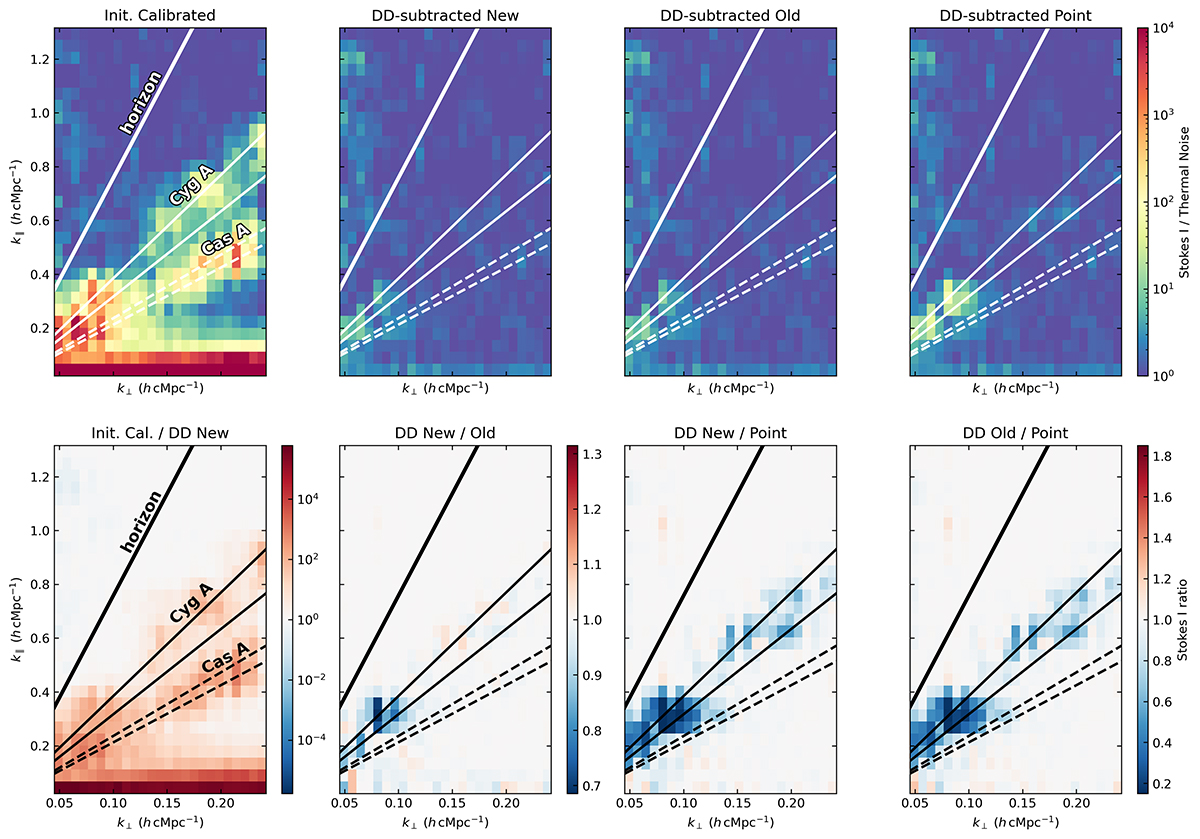
Fig. 7.
Stokes I cylindrical power spectra divided by the thermal noise power spectrum at different stages of the processing of the simulated NCP dataset. Top row, from left to right: power spectrum ratio after initial calibration, after DD subtraction using the new, old, and point source model of Cyg A. The bottom row shows ratios of results from processing with different models. From left to right: the initial calibration results over new model results, new model results over old model results, new model results over point source model results, and old model results over point source model results. ‘DD New/Point’ and ‘DD Old/Point’ share the same colour bar. In all the panels, the thick line indicates the horizon delay line (foreground wedge), whereas the thin solid and dashed line pairs indicate the delay ranges where we expect most of the power of Cyg A and Cas A, respectively.
Current usage metrics show cumulative count of Article Views (full-text article views including HTML views, PDF and ePub downloads, according to the available data) and Abstracts Views on Vision4Press platform.
Data correspond to usage on the plateform after 2015. The current usage metrics is available 48-96 hours after online publication and is updated daily on week days.
Initial download of the metrics may take a while.