Fig. 5.
Download original image
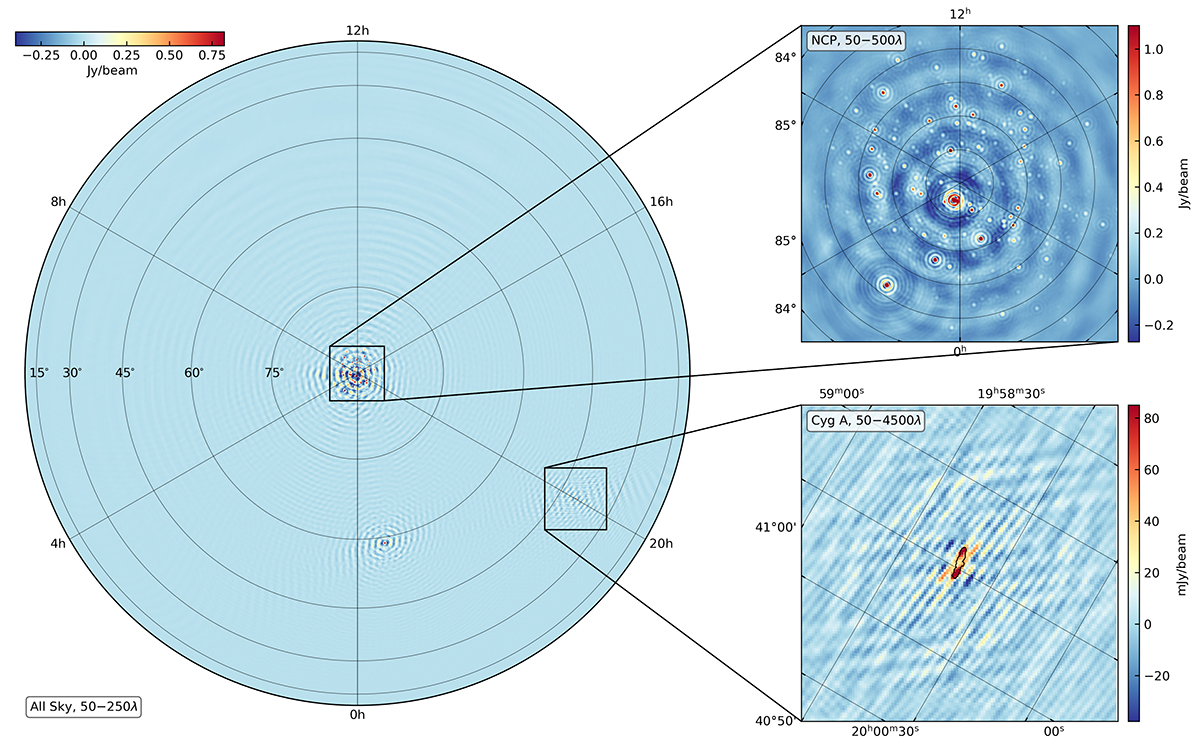
All sky dirty image of the simulated NCP dataset (left), with zoom-in to the NCP main field (top right) and the Cyg A direction (bottom right). The all sky image has been obtained using a baseline range of 50 − 250λ, the NCP zoom-in with 50 − 500λ, while the Cyg A zoom-in with 50 − 4500λ. A natural weighting scheme has been used for the all sky and the NCP zoom-in images, whereas a uniform weighting has been chosen for the Cyg A zoom-in to make the source structures more visible. The contour in the bottom right panel is the 1 Jy/beam level from Fig. 1 to show the position and extension of Cyg A.
Current usage metrics show cumulative count of Article Views (full-text article views including HTML views, PDF and ePub downloads, according to the available data) and Abstracts Views on Vision4Press platform.
Data correspond to usage on the plateform after 2015. The current usage metrics is available 48-96 hours after online publication and is updated daily on week days.
Initial download of the metrics may take a while.