Fig. 3.
Download original image
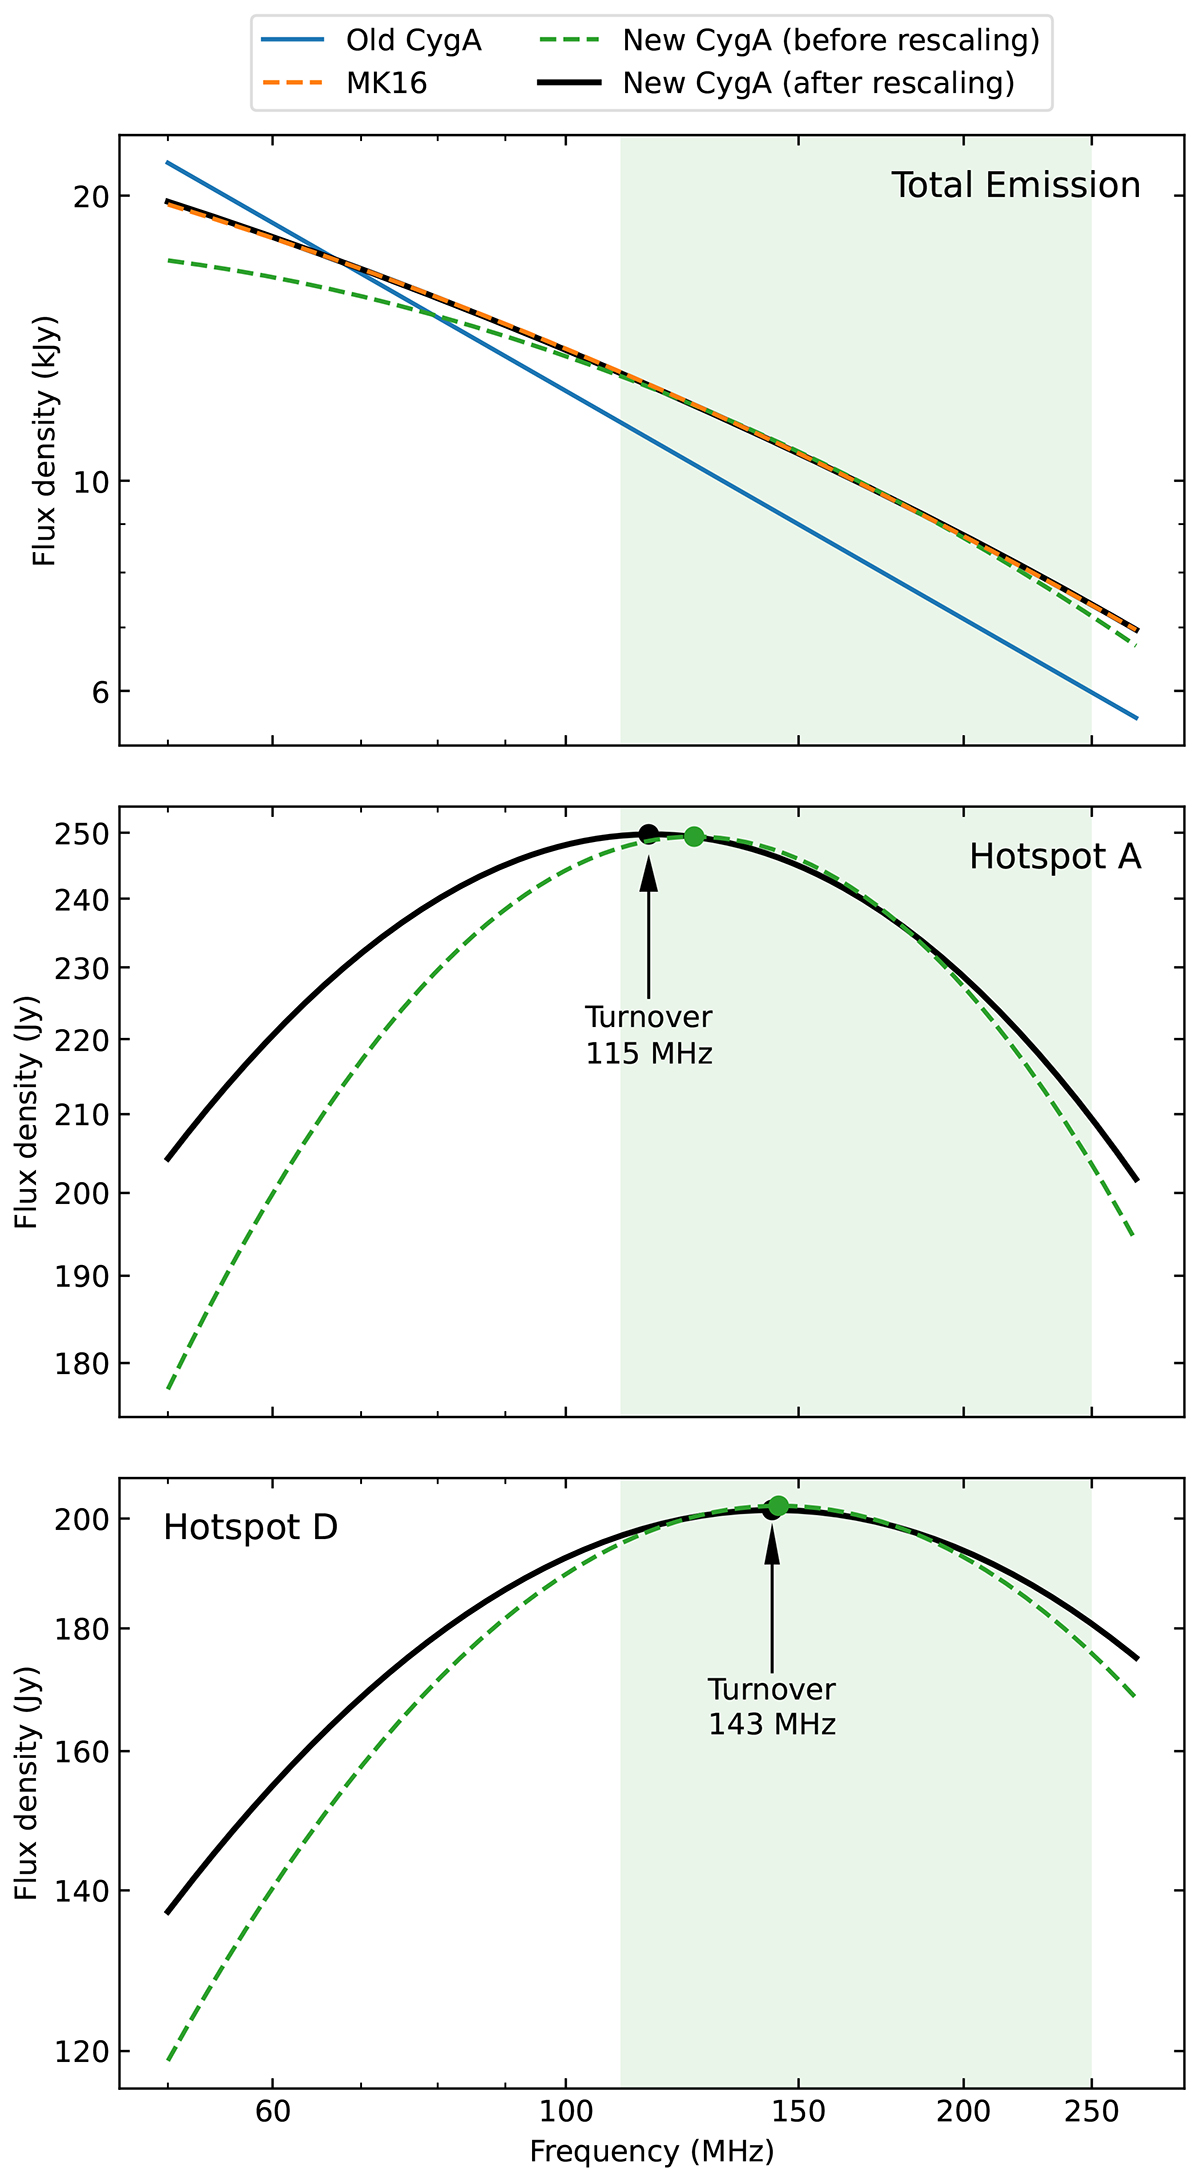
Flux density between 50 and 270 MHz measured from the Cyg A models for the total emission (top), hotspot A (middle), and hotspot D (bottom). The top panel shows the old model (solid blue line), the new model before (dashed green line) and after spectral rescaling (solid black line), and the third-order logarithmic polynomial used by MK16 (dashed orange line). In the middle and bottom panels, only the flux densities from the new Cyg A models before and after rescaling are shown. These values were extracted from a circular region with a 5 arcsec diameter, centred on the peak of each hotspot. The filled points indicate the spectral peaks, and the turnover frequency after rescaling is also reported. The green shaded area in all panels marks the LOFAR HBA range used to extract the new Cyg A model.
Current usage metrics show cumulative count of Article Views (full-text article views including HTML views, PDF and ePub downloads, according to the available data) and Abstracts Views on Vision4Press platform.
Data correspond to usage on the plateform after 2015. The current usage metrics is available 48-96 hours after online publication and is updated daily on week days.
Initial download of the metrics may take a while.