Fig. 11.
Download original image
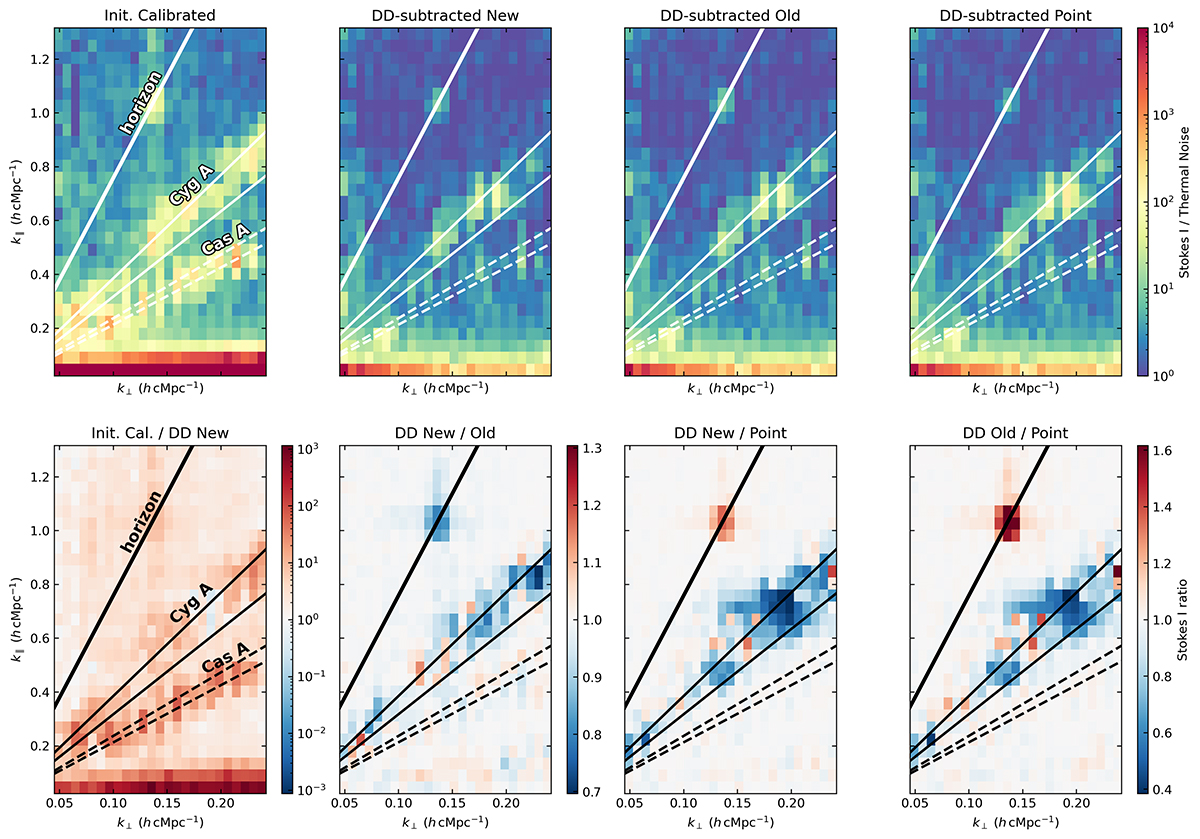
Stokes I cylindrical power spectra divided by the thermal noise power spectrum at different stages of the processing of the real observed NCP dataset. Top row, from left to right: power spectrum ratio after initial calibration, after DD subtraction using the new, old, and point source model of Cyg A. The bottom row shows ratios of results from processing with different models. From left to right: the initial calibration results over new model results, new model results over old model results, new model results over point source model results, and old model results over point source model results. ‘DD New/Point’ and ‘DD Old/Point’ share the same colour bar. In all the panels, the thick line indicates the horizon delay line (foreground wedge), whereas the thin solid and dashed line pairs indicate the delay ranges where we expect most of the power of Cyg A and Cas A, respectively.
Current usage metrics show cumulative count of Article Views (full-text article views including HTML views, PDF and ePub downloads, according to the available data) and Abstracts Views on Vision4Press platform.
Data correspond to usage on the plateform after 2015. The current usage metrics is available 48-96 hours after online publication and is updated daily on week days.
Initial download of the metrics may take a while.