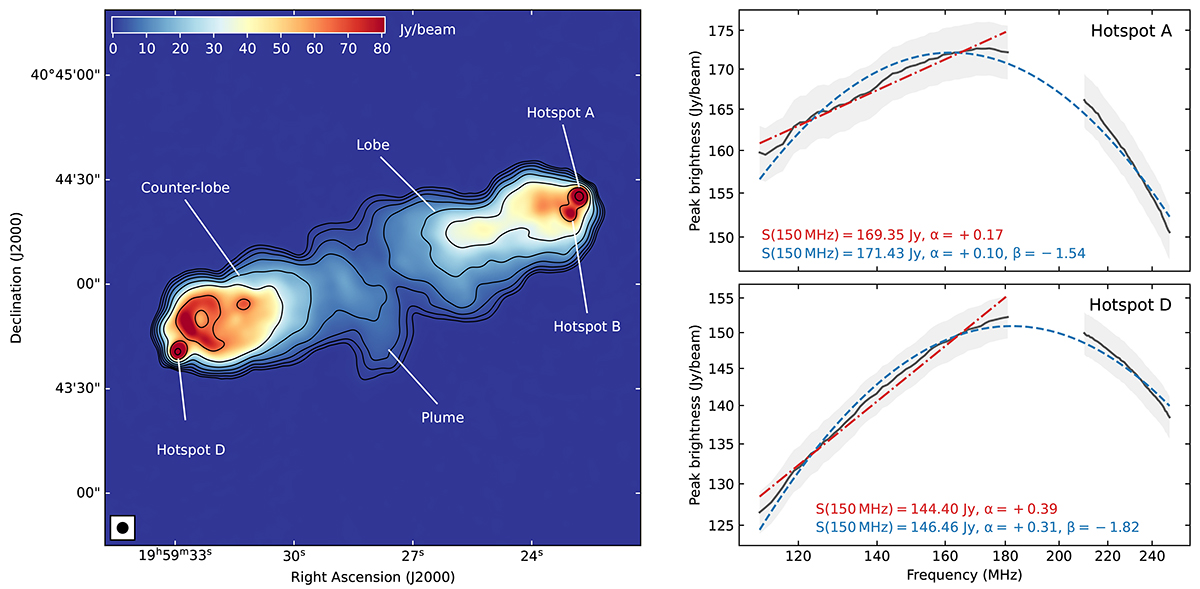
Fig. 1.
Download original image
High-resolution, frequency-integrated image of Cyg A between 111 and 249 MHz (left), and peak brightness of the hotspots A (top right) and D (bottom right), extracted from the high-resolution images of the 100 output channels (black solid line, with 1σ uncertainties shown as a grey shaded area). The fits using a second-order (blue dashed line) and a first-order logarithmic polynomial function (red dot-dashed line) are also shown, with the best fit parameters reported in the same colours. The latter has been fitted only between 111 and 181 MHz for a consistent comparison with MK16. The image on the left has a noise level of σ = 10 mJy/beam, with contours starting at 1 Jy/beam and increasing by a factor of 2.
Current usage metrics show cumulative count of Article Views (full-text article views including HTML views, PDF and ePub downloads, according to the available data) and Abstracts Views on Vision4Press platform.
Data correspond to usage on the plateform after 2015. The current usage metrics is available 48-96 hours after online publication and is updated daily on week days.
Initial download of the metrics may take a while.