Open Access
Fig. B.1.
Download original image
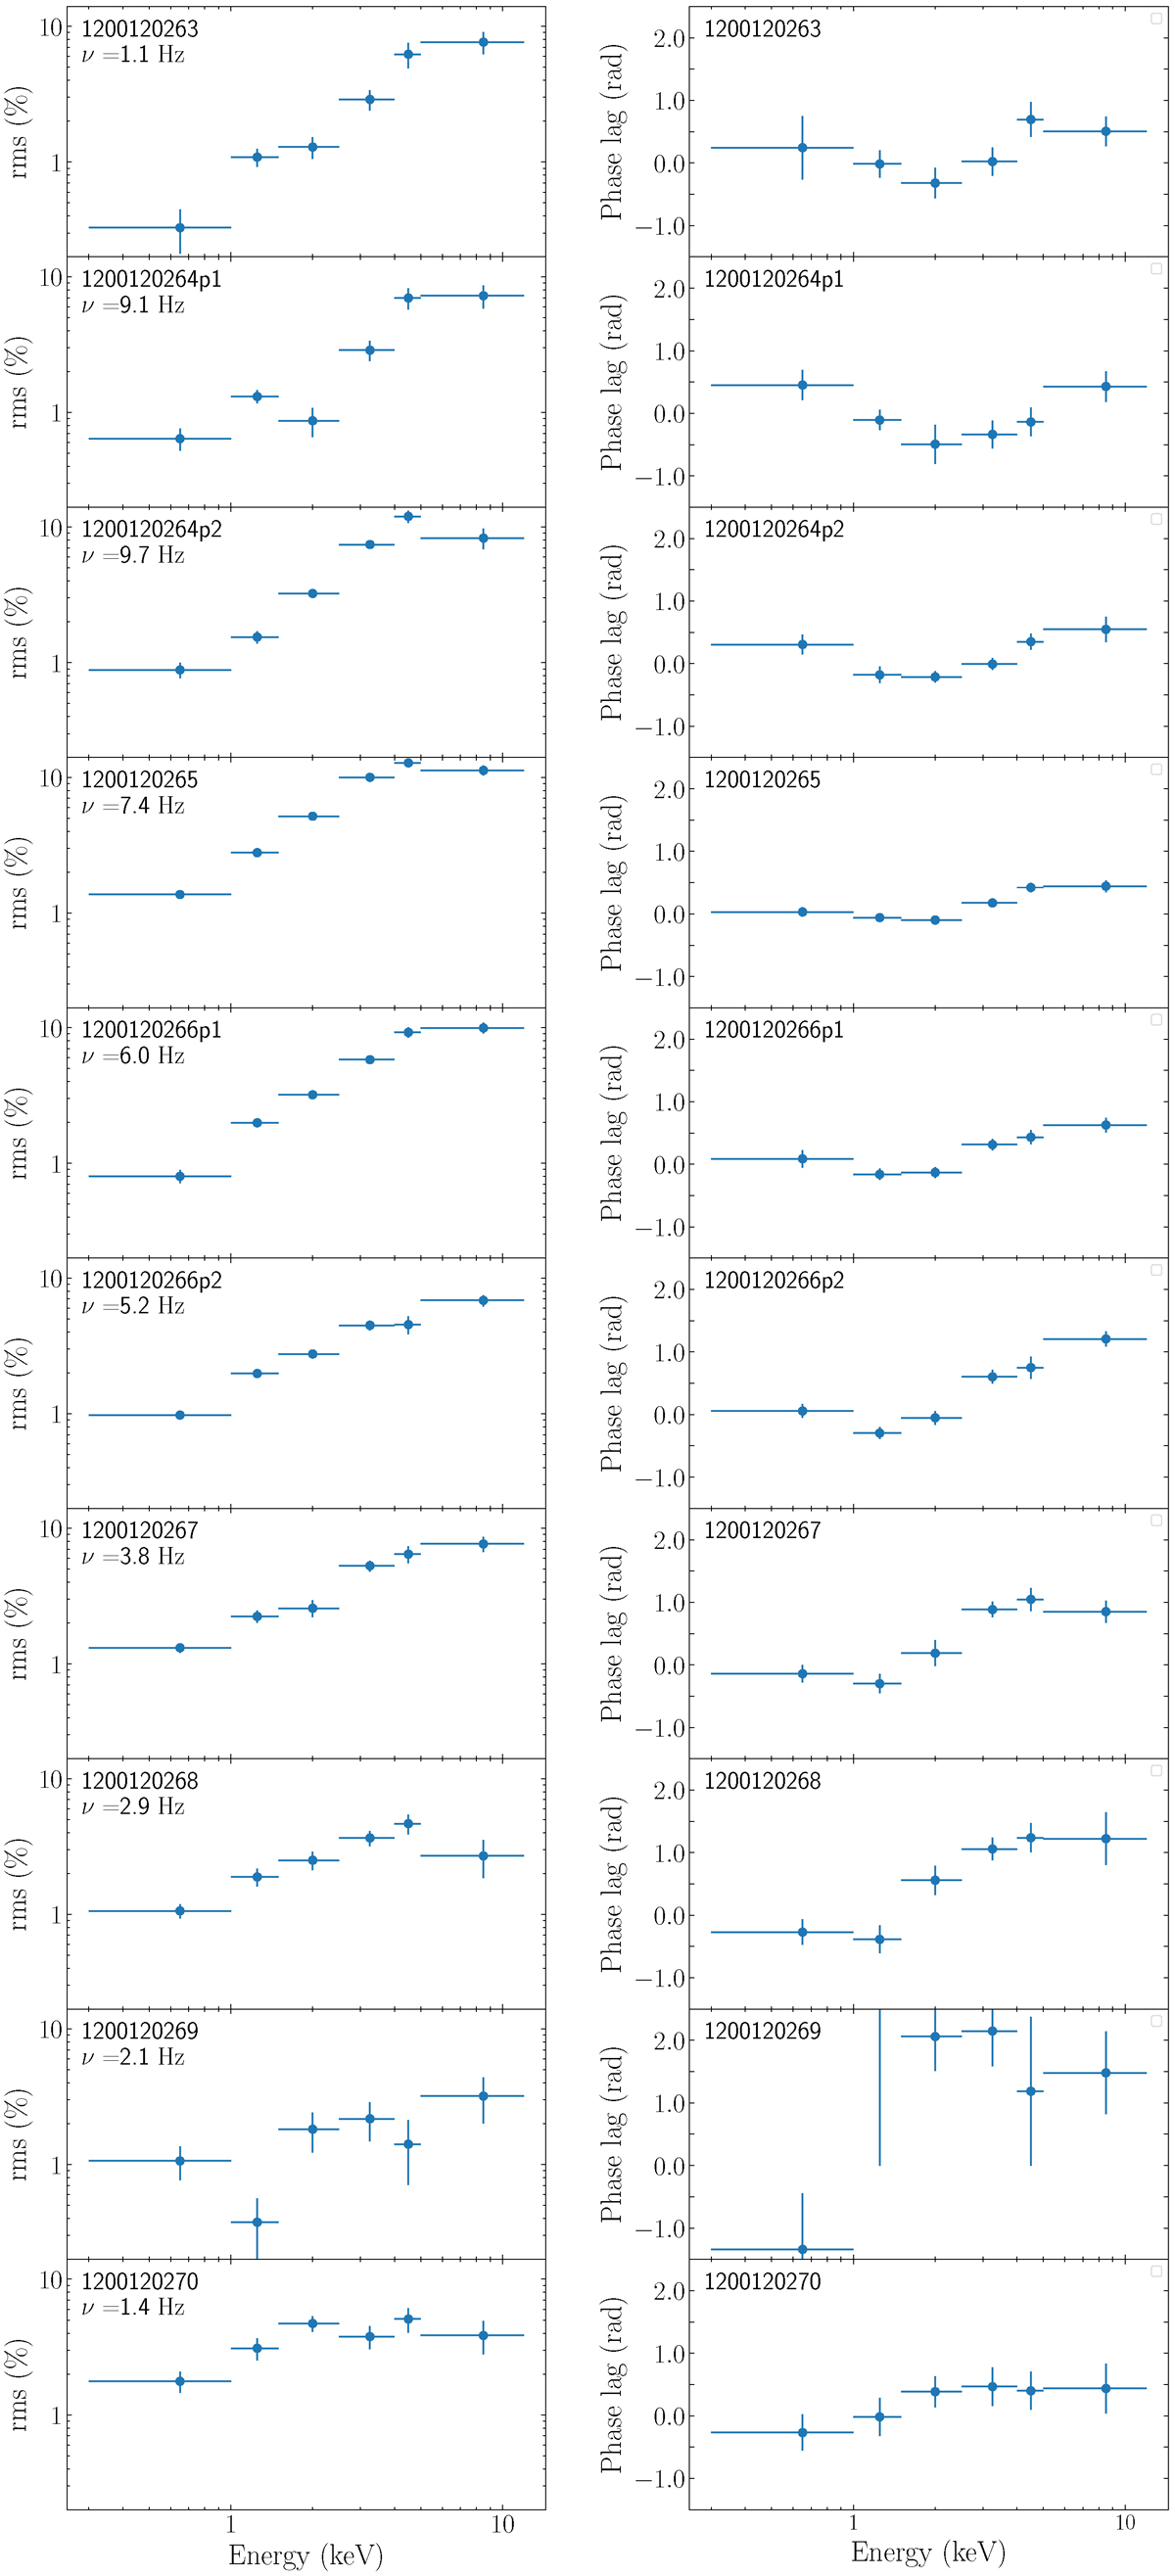
rms (left panels) and phase-lag (right panels) energy spectra of the real/imaginary QPO for the NICER observations of MAXI J1820+070 in the HSS-to-LHS transition. Horizontal lines cover the range of the energy band corresponding to each marker.
Current usage metrics show cumulative count of Article Views (full-text article views including HTML views, PDF and ePub downloads, according to the available data) and Abstracts Views on Vision4Press platform.
Data correspond to usage on the plateform after 2015. The current usage metrics is available 48-96 hours after online publication and is updated daily on week days.
Initial download of the metrics may take a while.