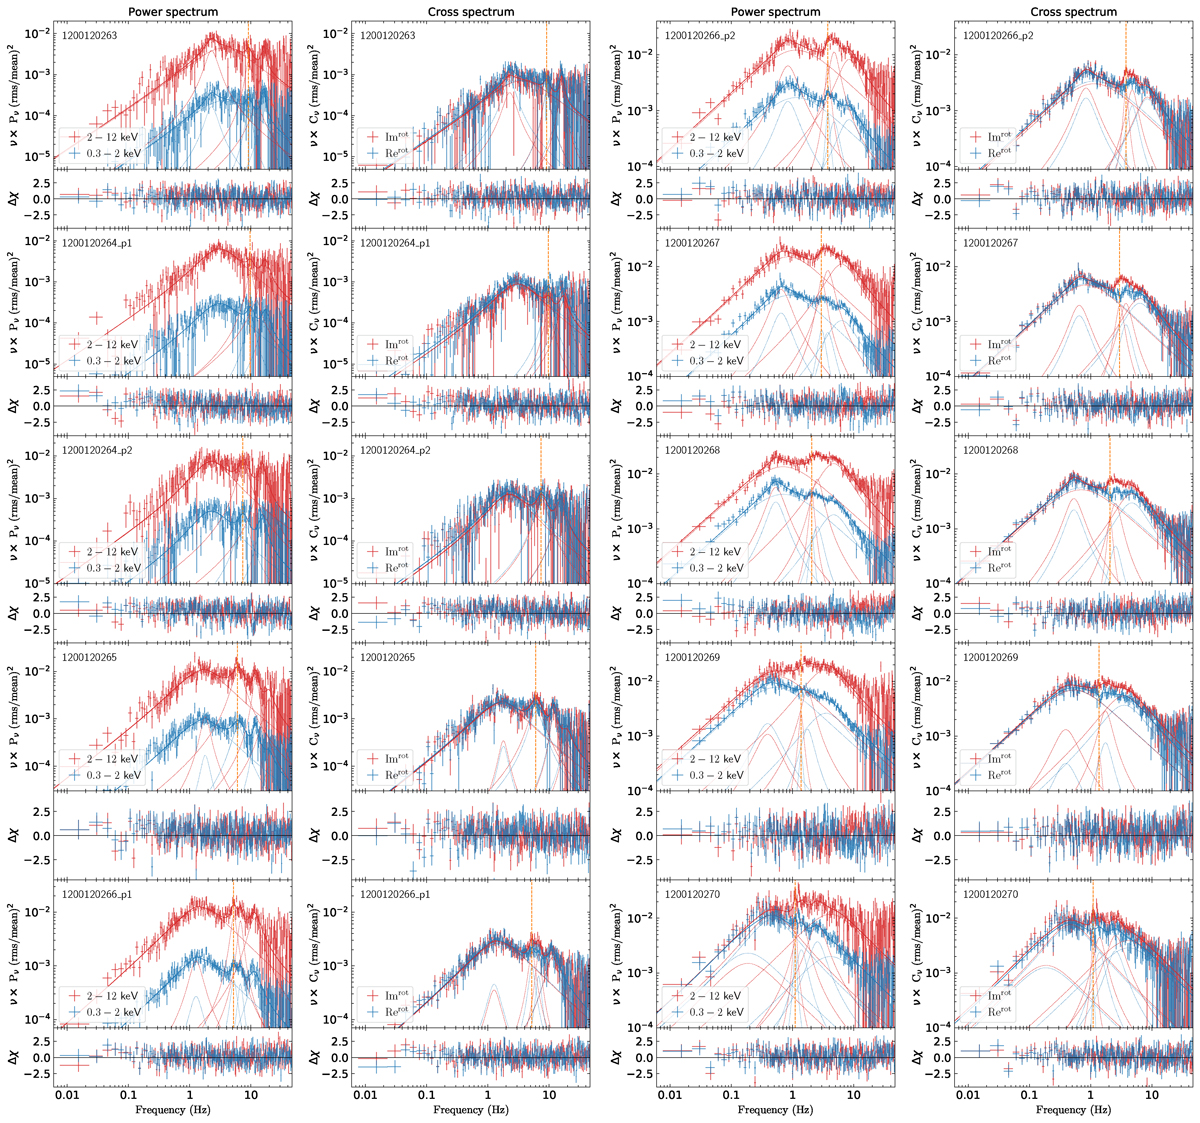
Fig. A.1.
Download original image
First and third columns: PS in two energy bands of NICER observations of MAXI J1820+070 covering the HSS-to-LHS transition. The 0.3 − 2 keV data are shown in blue while the 2 − 12 keV one is in red, both with the best-fitting model (solid line) consisting of a combination of Lorentzian functions (dotted lines). Second and fourth columns: Real and imaginary parts of the CS between the same two energy bands rotated by 45°. We plot Re cos(π/4)−Im sin(π/4) in blue and Re sin(π/4)+Im cos(π/4) in red, with the best-fitting model assuming the constant phase-lag model. In each panel, residuals with respect to the model, defined as Δχ = (data − model)/error, are also plotted. The dashed orange vertical line in each panel corresponds to the centroid frequency of the real/imaginary QPO in the model.
Current usage metrics show cumulative count of Article Views (full-text article views including HTML views, PDF and ePub downloads, according to the available data) and Abstracts Views on Vision4Press platform.
Data correspond to usage on the plateform after 2015. The current usage metrics is available 48-96 hours after online publication and is updated daily on week days.
Initial download of the metrics may take a while.