Fig. 7.
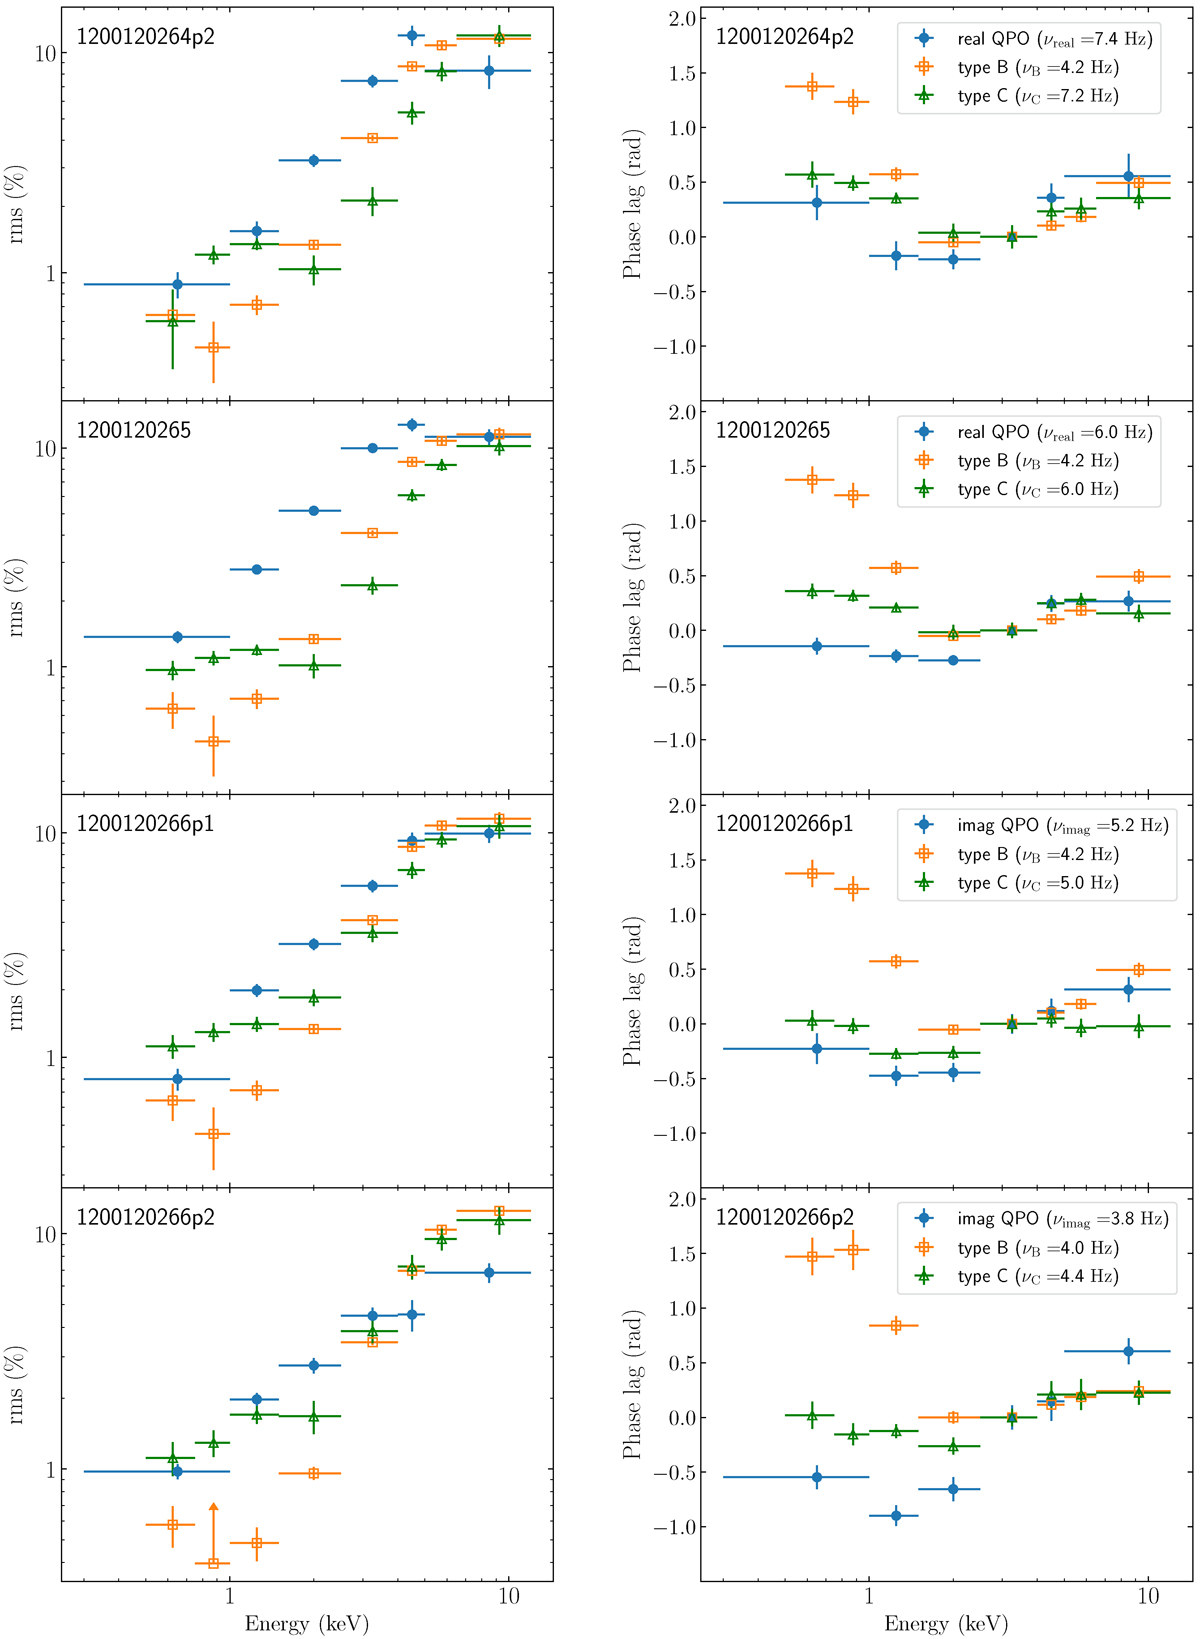
Download original image
rms (left panels) and phase-lag (right panels) spectra of the real/imaginary (blue circles), type-B (orange squares) and type-C (green triangles) QPOs in MAXI J1820+070. From top to bottom, the panels correspond to observations 1200120264_p2, 1200120265, 1200120266_p1 and 1200120266_p2 of MAXI J1820+070. The real and imaginary QPOs are from this work, while the type B and C QPOs are from observation 1200120197 analysed by Ma et al. (2023). For the comparison, we selected type-B and C QPOs with centroid frequencies most similar to those of the real/imaginary QPOs. Horizontal lines cover the range of the energy band corresponding to each marker.
Current usage metrics show cumulative count of Article Views (full-text article views including HTML views, PDF and ePub downloads, according to the available data) and Abstracts Views on Vision4Press platform.
Data correspond to usage on the plateform after 2015. The current usage metrics is available 48-96 hours after online publication and is updated daily on week days.
Initial download of the metrics may take a while.