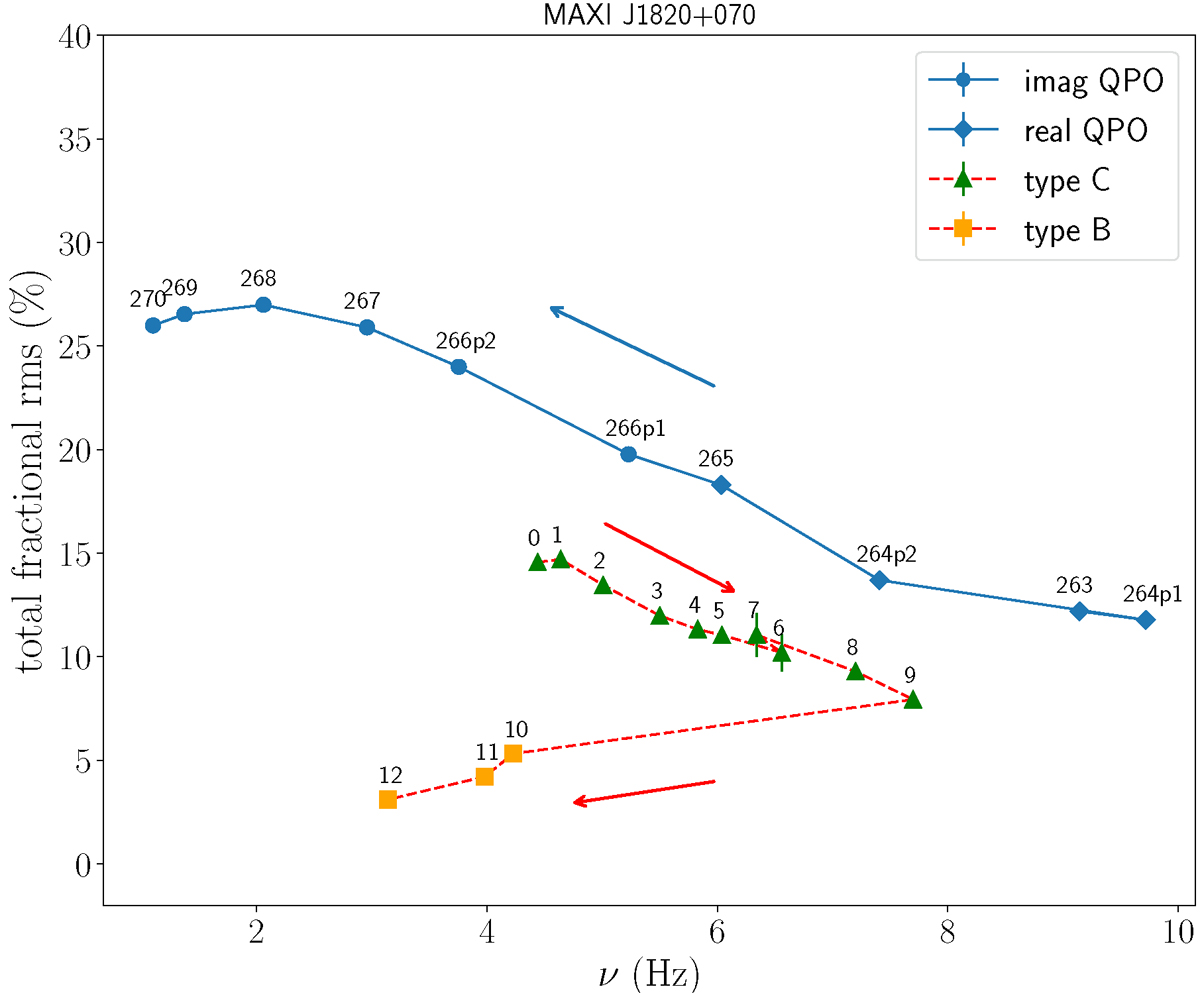
Fig. 6.
Download original image
Total fractional rms in the 0.3–12 keV band integrated from 0.1 to 50 Hz versus the centroid frequency of the QPO in MAXI J1820+070 (blue), with both quantities derived from our fitted model. Diamonds correspond to observations 1200120263-1200120265 while dots correspond to observations 1200120266_p1-1200120270. Green triangles and orange squares depict the type B and C QPOs identified in each orbit of observation 1200120197, which covered the HIMS-SIMS transition, studied by Ma et al. (2023). The solid and dashed lines connect the QPOs during the source hardening and softening respectively. Arrows indicate the direction of time progression in each sequence.
Current usage metrics show cumulative count of Article Views (full-text article views including HTML views, PDF and ePub downloads, according to the available data) and Abstracts Views on Vision4Press platform.
Data correspond to usage on the plateform after 2015. The current usage metrics is available 48-96 hours after online publication and is updated daily on week days.
Initial download of the metrics may take a while.