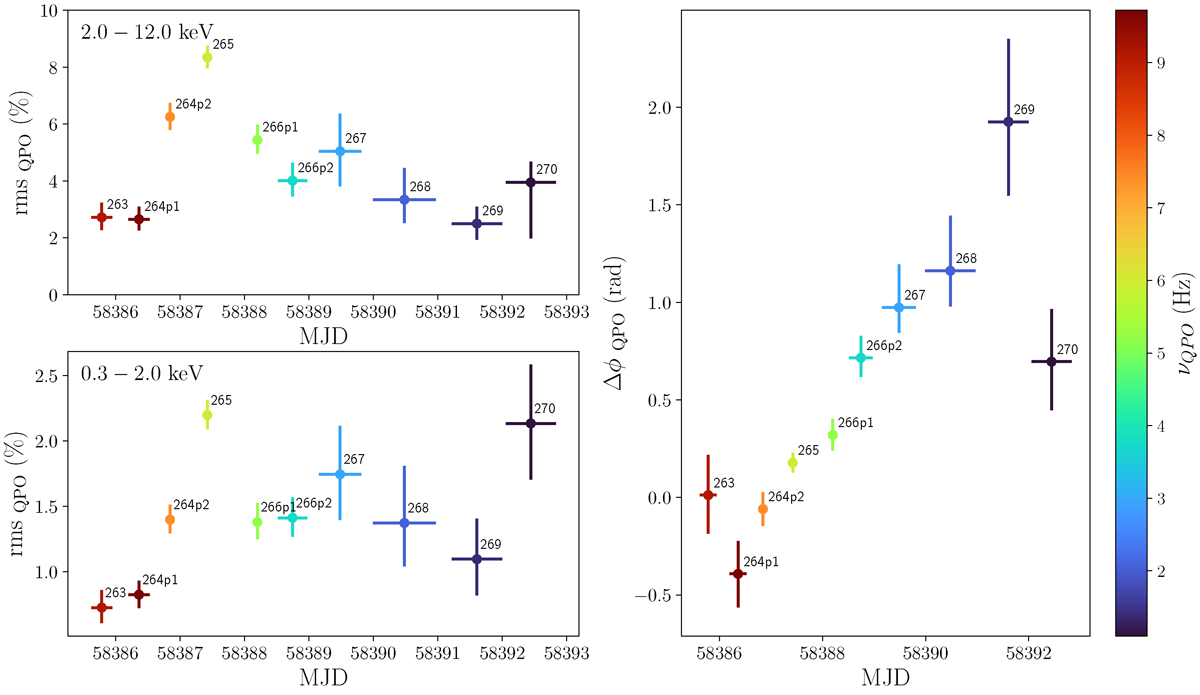
Fig. 5.
Download original image
Evolution of the rms amplitude of the QPO in the 2.0 − 12.0 keV band (top left) and in the 0.3 − 2.0 keV band (bottom left) as MAXI J1820+070 transitions out of the HSS. The right panel displays the evolution of the phase lags of the QPO for the 2.0 − 12.0 keV band with respect to the 0.3 − 2.0 keV band. The rms and phase lags are derived from the fitted Lorentzian in our model (see Sect. 3). In the three panels, the horizontal bars correspond to the time duration of each observation, while the vertical bars are the actual 1 − σ errors of each quantity. The colour gradient depicts the centroid frequency of the QPO.
Current usage metrics show cumulative count of Article Views (full-text article views including HTML views, PDF and ePub downloads, according to the available data) and Abstracts Views on Vision4Press platform.
Data correspond to usage on the plateform after 2015. The current usage metrics is available 48-96 hours after online publication and is updated daily on week days.
Initial download of the metrics may take a while.