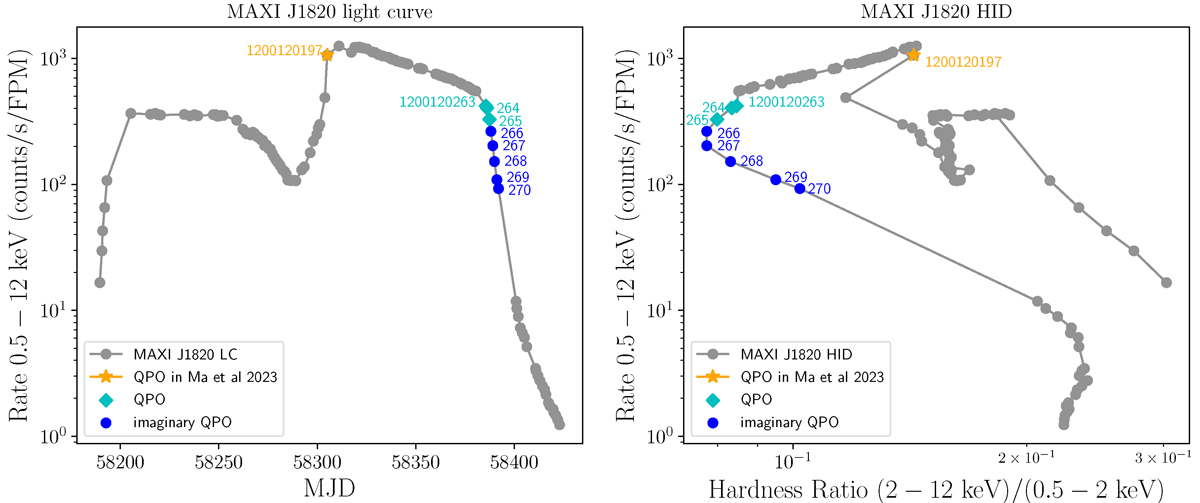
Fig. 1.
Download original image
NICER X-ray light curve (left panel) and hardness-intensity diagram (right panel) of MAXI J1820+070 during its 2018 outburst. The intensity in both panels is the count rate per detector in the 0.5 − 12 keV band, while the hardness ratio in the right panel is the ratio of the count rates in the 2 − 12 keV to that in 0.5 − 12 keV. Each point corresponds to one obsID within 1200120101 − 1200120293. Light blue diamonds (obsIDs 1200120263 − 1200120265) and blue dots (obsIDs 1200120266 − 1200120270) depict the observations considered in this paper, in particular, the second ones correspond to those presenting narrow features in the phase lags and the coherence function. The orange star represents the observation 1200120197 studied by Ma et al. (2023), which covered the transition of type-C to a type-B QPO.
Current usage metrics show cumulative count of Article Views (full-text article views including HTML views, PDF and ePub downloads, according to the available data) and Abstracts Views on Vision4Press platform.
Data correspond to usage on the plateform after 2015. The current usage metrics is available 48-96 hours after online publication and is updated daily on week days.
Initial download of the metrics may take a while.