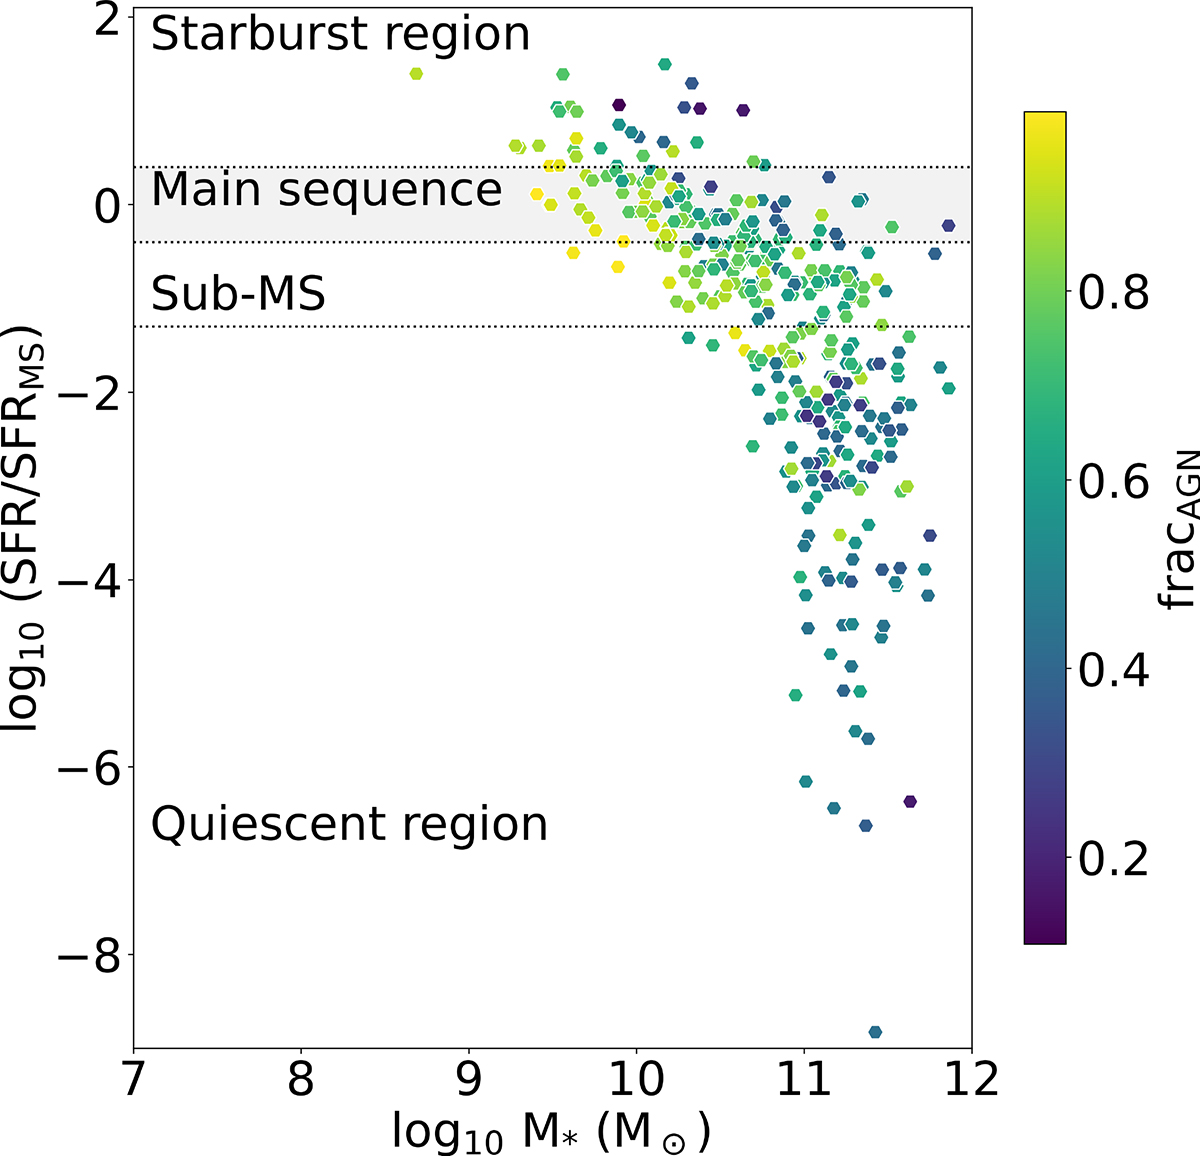
Fig. 7.
Download original image
Measurements of the logarithm of the ratio SFR/SFRMS as a function of the logarithm of stellar mass, M*. The SFRs relative to the MS of star formation for galaxies were computed assuming the average redshift from our QSO2 candidate sample, z = 1.1, and using the relation from Schreiber et al. (2015). The dashed line separates the MS and the SB region at 0.4 dex, as defined by Aird et al. (2019). The blue-shaded area defines the MS region. Each point is colour-coded based on the estimated AGN fraction of CIGALE, fracAGN.
Current usage metrics show cumulative count of Article Views (full-text article views including HTML views, PDF and ePub downloads, according to the available data) and Abstracts Views on Vision4Press platform.
Data correspond to usage on the plateform after 2015. The current usage metrics is available 48-96 hours after online publication and is updated daily on week days.
Initial download of the metrics may take a while.