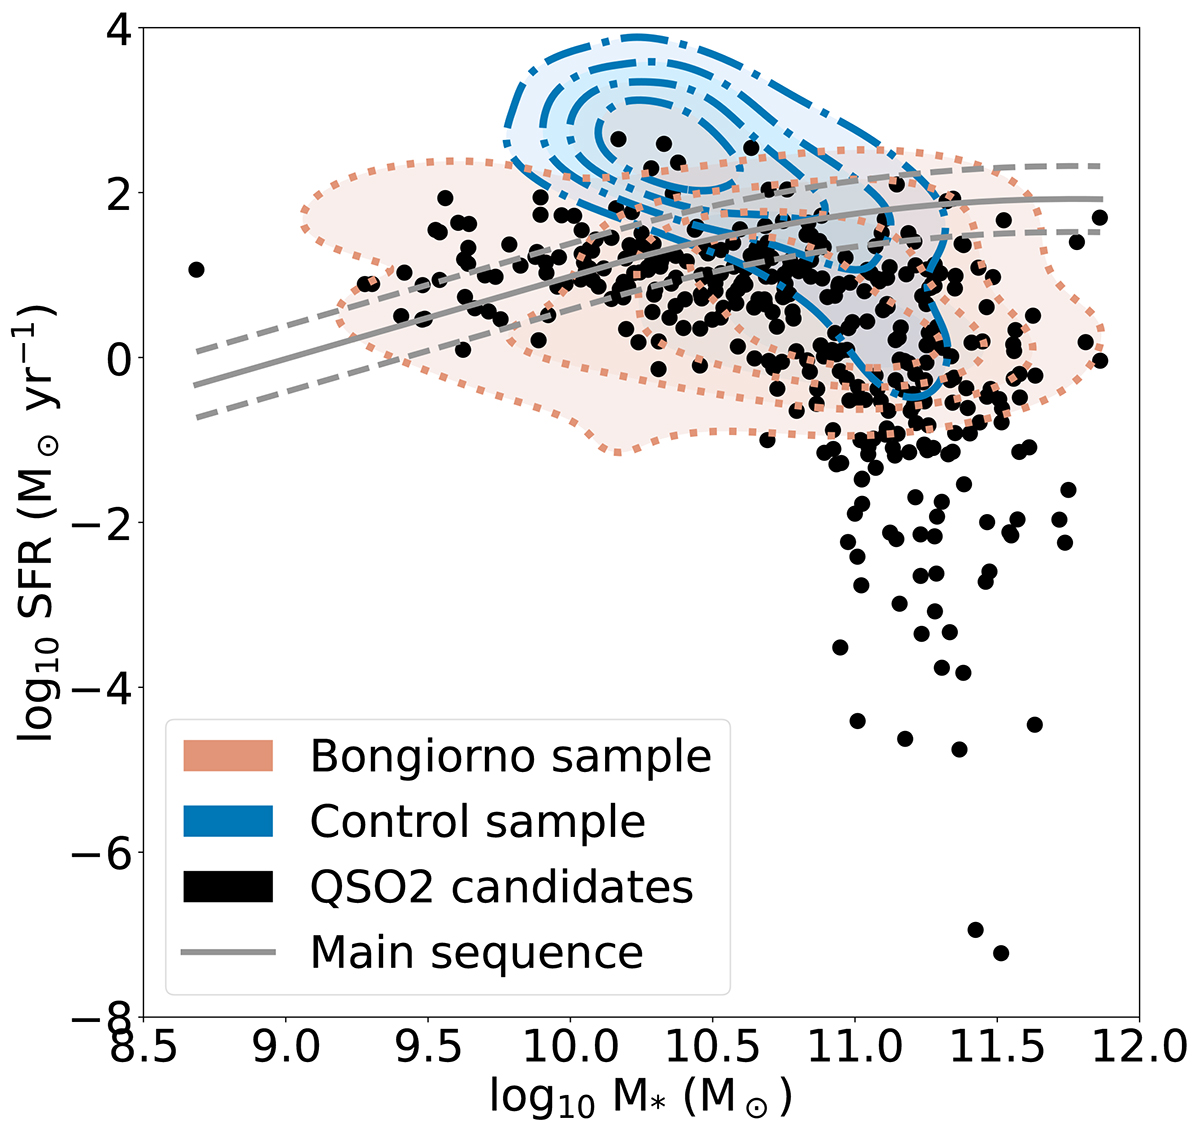
Fig. 3.
Download original image
SFR as a function of stellar mass (M*) for the QSO2 candidates (black dots) on a logarithmic scale. The star formation MS described by Schreiber et al. (2015) at the mean SDSS spectroscopic redshift of our candidates (z = 1.1) is shown as a solid line, with dashed lines indicating a 0.4 dex deviation. The contours display the M*–SFR distribution for X-ray and optically selected AGN2s from the zCOSMOS survey by Bongiorno et al. (2012) with redshifts 1 ≤ z ≤ 2 (orange) and for the control sample of SDSS galaxies (blue).
Current usage metrics show cumulative count of Article Views (full-text article views including HTML views, PDF and ePub downloads, according to the available data) and Abstracts Views on Vision4Press platform.
Data correspond to usage on the plateform after 2015. The current usage metrics is available 48-96 hours after online publication and is updated daily on week days.
Initial download of the metrics may take a while.