Fig. 2.
Download original image
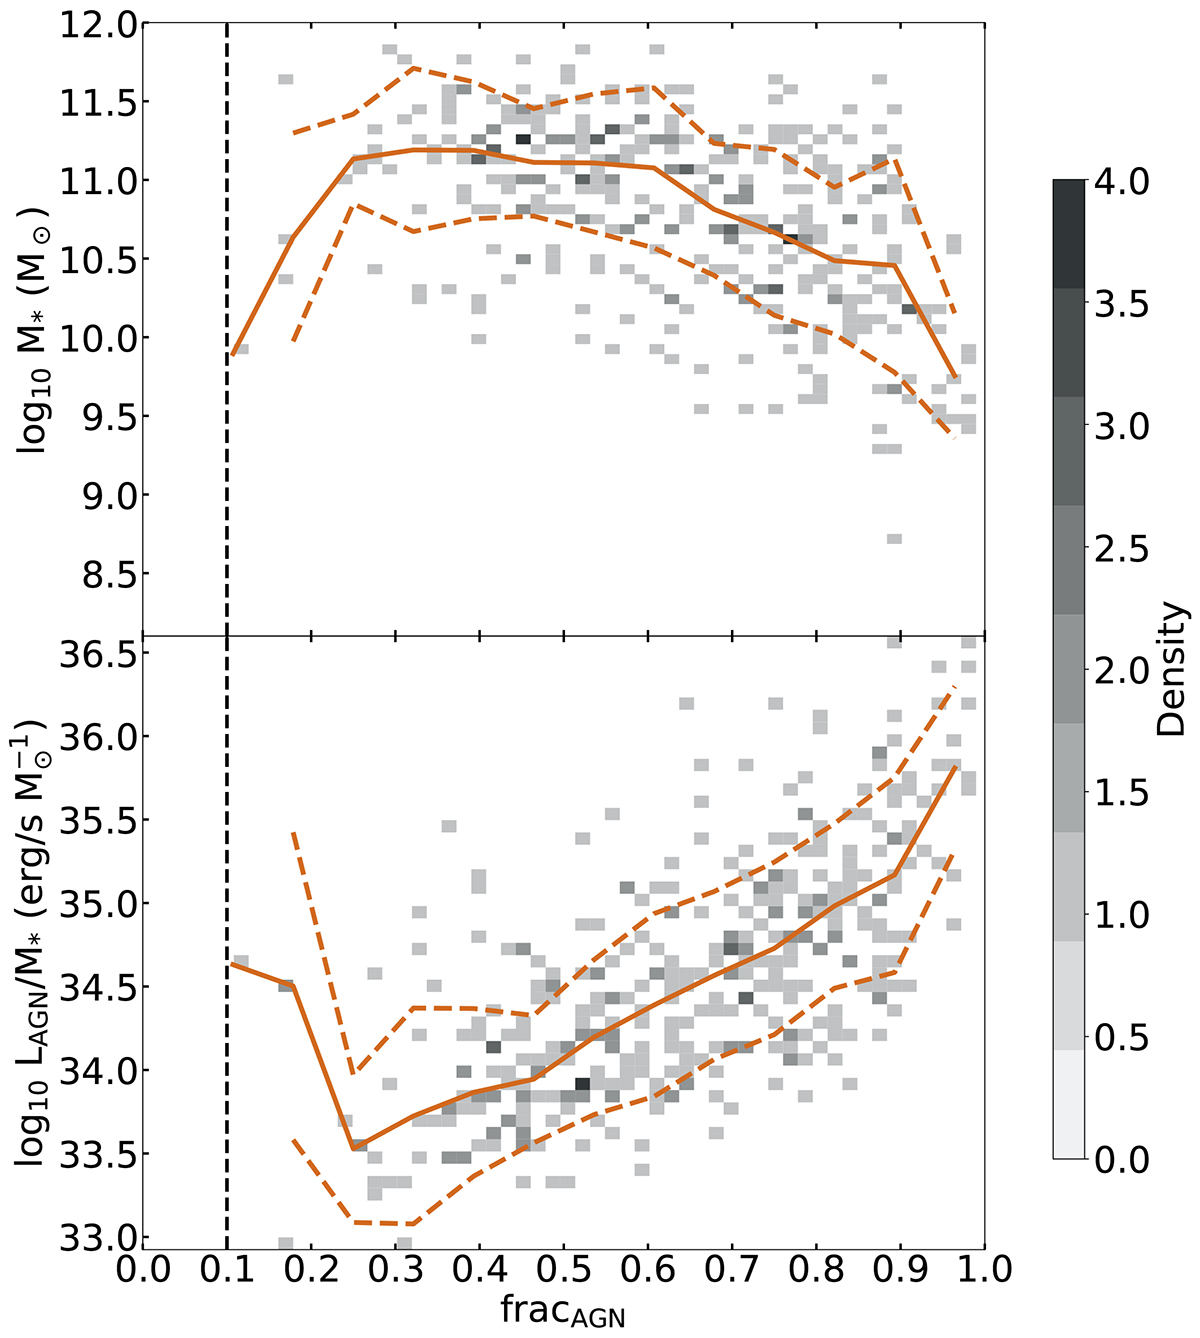
2D histogram of the stellar mass, M* (top) and specific AGN luminosity, LAGN/M*, defined in Thorne et al. (2022, bottom), as a function of fracAGN for the QSO2 sample. The colour gradient indicates the density of sources for each bin. The median and standard deviation are represented by the solid and dashed orange lines, respectively. The vertical black line indicates the fracAGN > 0.1 threshold used in Leja et al. (2018) to characterise sources with significant AGN contribution.
Current usage metrics show cumulative count of Article Views (full-text article views including HTML views, PDF and ePub downloads, according to the available data) and Abstracts Views on Vision4Press platform.
Data correspond to usage on the plateform after 2015. The current usage metrics is available 48-96 hours after online publication and is updated daily on week days.
Initial download of the metrics may take a while.