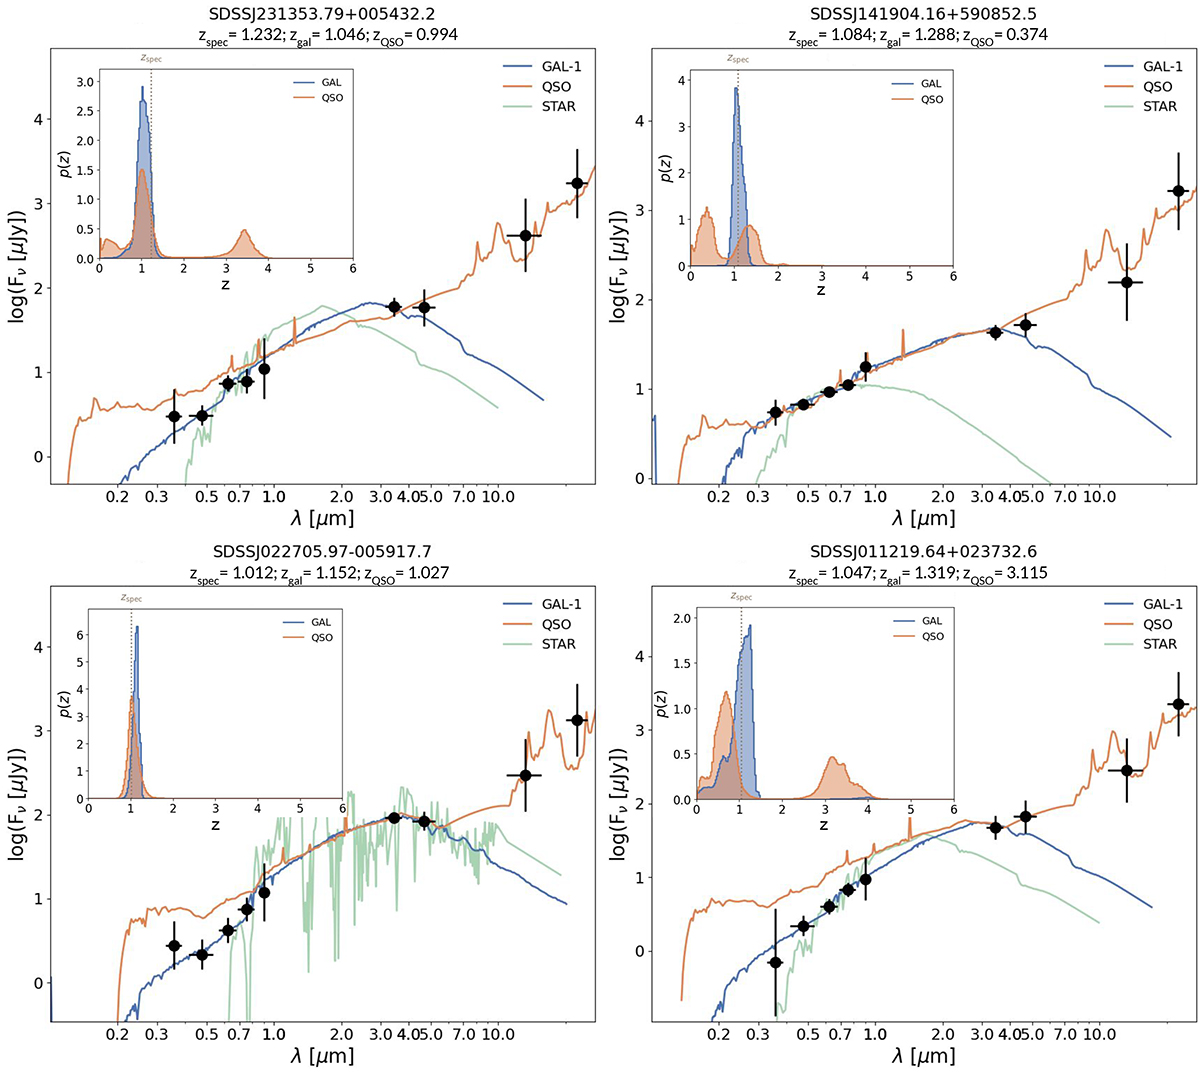
Fig. B.1.
Download original image
Examples of the best-fitting models for photometric redshift estimation using LePhare++ for four sources. Filled symbols represent the observed flux densities from SDSS and WISE. Source classification is defined by the reduced χ2 value. The best-fit galaxy template is shown in blue, the best-fit QSO template in orange, and the best-fit star template in green. The histograms within each plot show the probability distribution function for the photometric redshift estimation, with the vertical dashed line indicating the spectroscopic redshift from SDSS.
Current usage metrics show cumulative count of Article Views (full-text article views including HTML views, PDF and ePub downloads, according to the available data) and Abstracts Views on Vision4Press platform.
Data correspond to usage on the plateform after 2015. The current usage metrics is available 48-96 hours after online publication and is updated daily on week days.
Initial download of the metrics may take a while.