Fig. 1.
Download original image
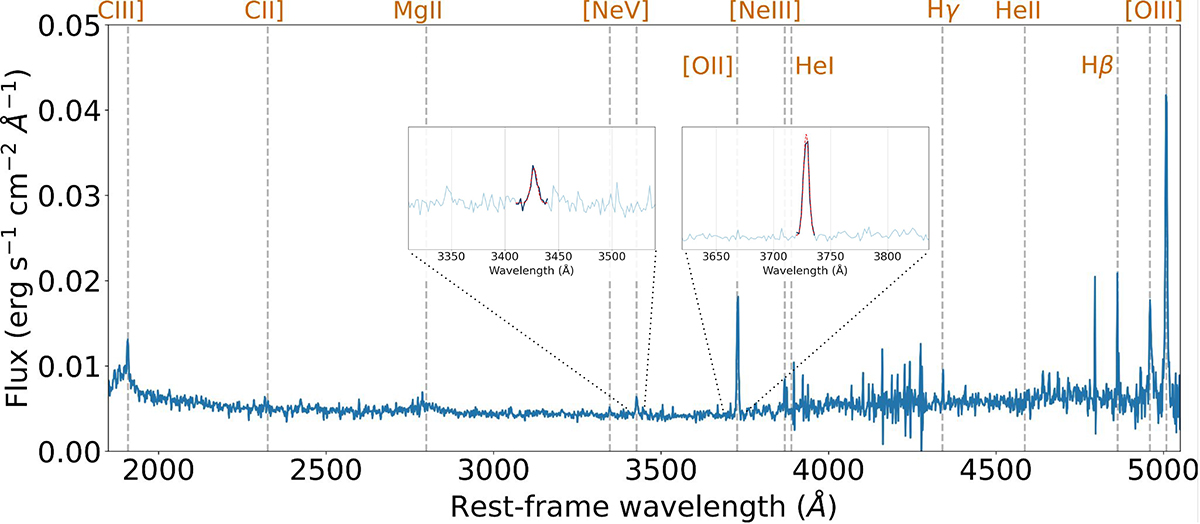
Stacked spectrum of QSO2 candidates with normalised median flux in the rest-frame wavelength, obtained through spline interpolation using available SDSS spectra. The spectrum is additionally normalised based on the number of contributing spectra for each rest-frame wavelength. Grey vertical lines mark the positions of emission lines in the rest frame. The plot includes two zoomed-in regions: (1) 3326–3526 Å, highlighting the [NeV]λ3426 emission line, and (2) 3630–3830 Å, highlighting the [OII]λλ3727, 3730 emission lines. The red line represents the Gaussian fit applied to the spectrum.
Current usage metrics show cumulative count of Article Views (full-text article views including HTML views, PDF and ePub downloads, according to the available data) and Abstracts Views on Vision4Press platform.
Data correspond to usage on the plateform after 2015. The current usage metrics is available 48-96 hours after online publication and is updated daily on week days.
Initial download of the metrics may take a while.