Fig. 6
Download original image
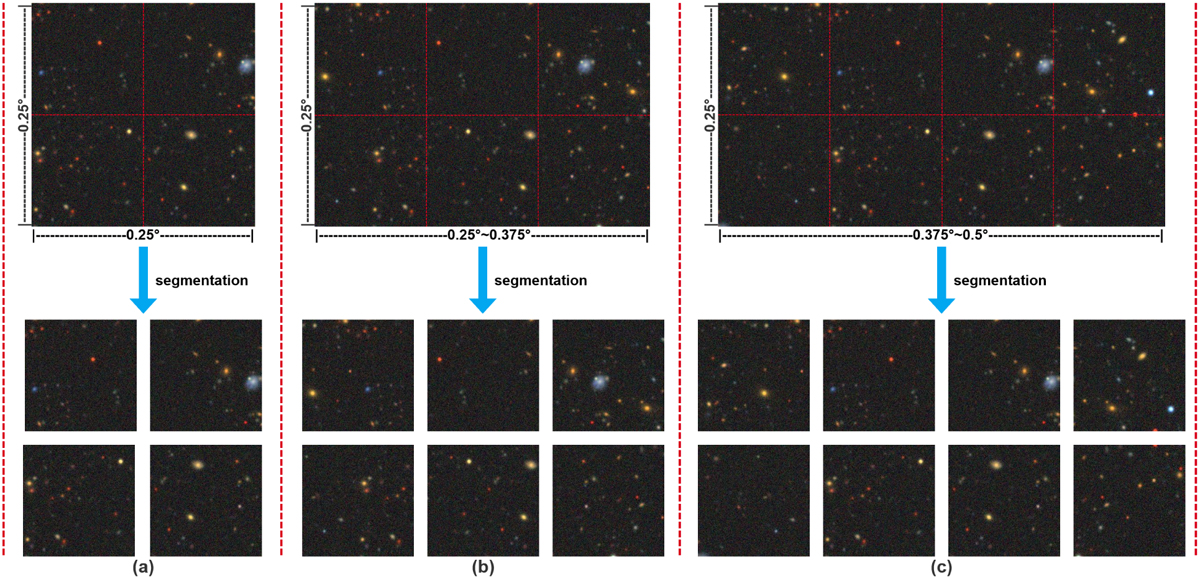
Brick segmentation diagram. (a), (b), and (c) represent the cutting strategies for three bricks of different sizes. The three images at the top are images of the brick, and the corresponding images at the bottom are images after segmentation. The brick images here are downloaded from DESI in equal proportions for us to illustrate the cutting strategy, and are not complete bricks. We mark the size of the brick boundary and use red dotted lines to illustrate the cutting position. It can be seen that our cutting on the Dec boundary is unchanged, while the cutting on the RA boundary is set according to the size of the boundary.
Current usage metrics show cumulative count of Article Views (full-text article views including HTML views, PDF and ePub downloads, according to the available data) and Abstracts Views on Vision4Press platform.
Data correspond to usage on the plateform after 2015. The current usage metrics is available 48-96 hours after online publication and is updated daily on week days.
Initial download of the metrics may take a while.