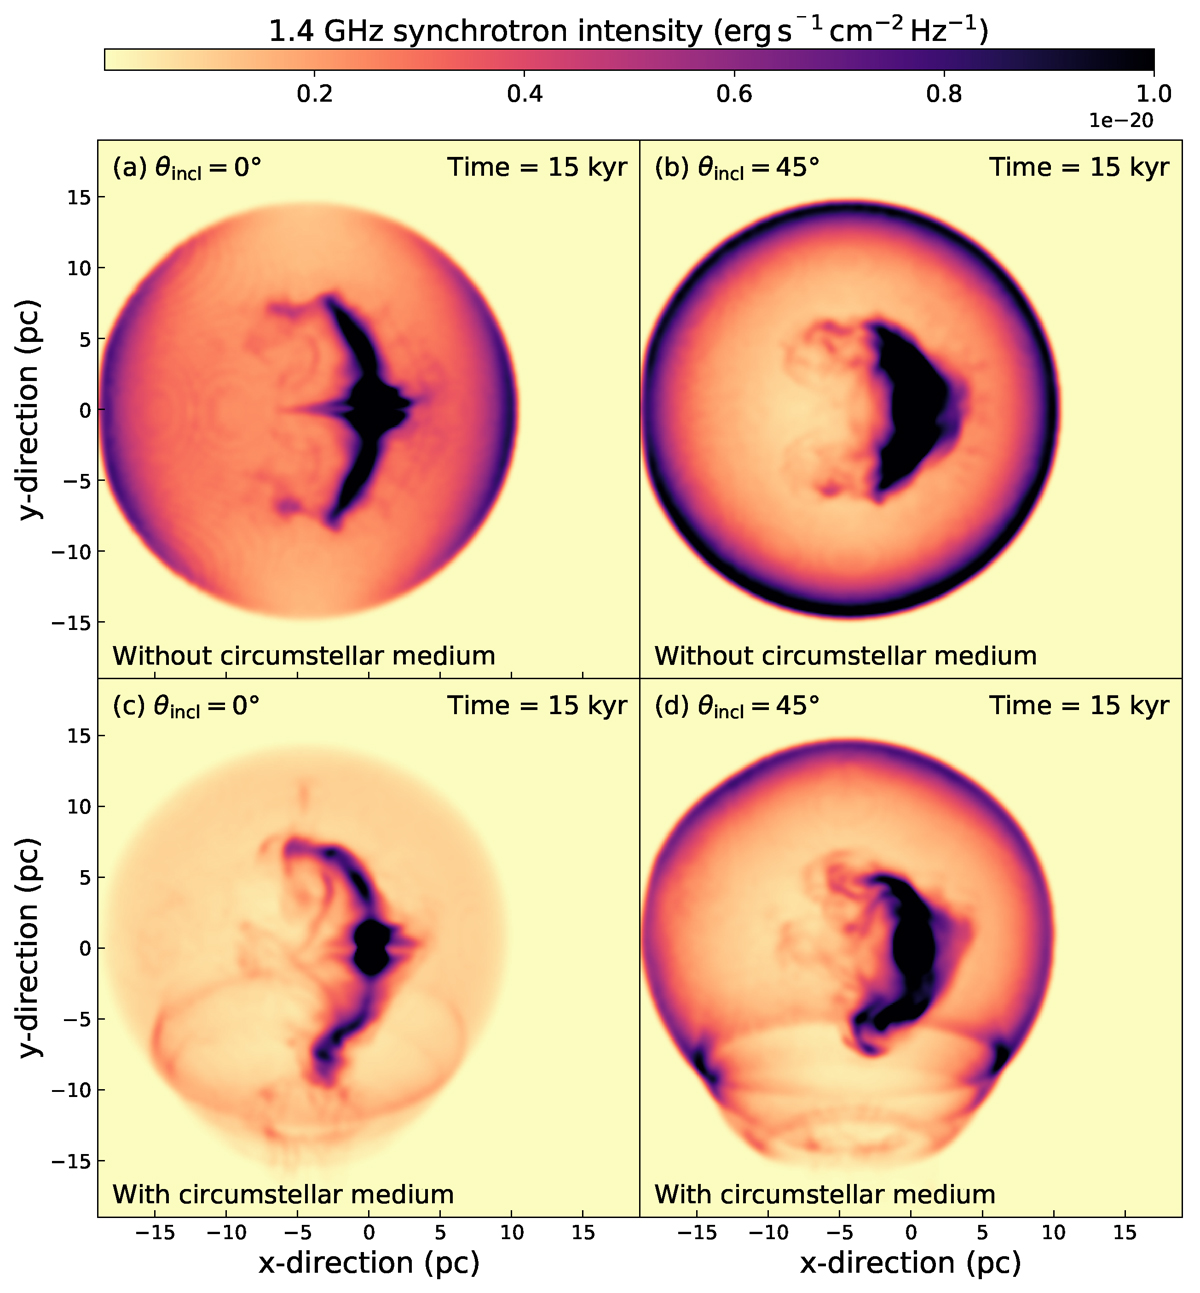
Fig. 3.
Download original image
Nonthermal 1.4 GHz radio synchrotron emission maps (in erg s1 cm2 sr1 Hz1) for the pulsar wind nebulae and their host SNR, without (a,b) and with (c,d) CSM. The maps are displayed with a viewing angle of θincl = 0° (a,c) and θincl = 45° (b,d). The dark color marks the regions of strong emission intensity, while the pale color marks the regions of fainter radio emission intensity, respectively.
Current usage metrics show cumulative count of Article Views (full-text article views including HTML views, PDF and ePub downloads, according to the available data) and Abstracts Views on Vision4Press platform.
Data correspond to usage on the plateform after 2015. The current usage metrics is available 48-96 hours after online publication and is updated daily on week days.
Initial download of the metrics may take a while.