Fig. 5.
Download original image
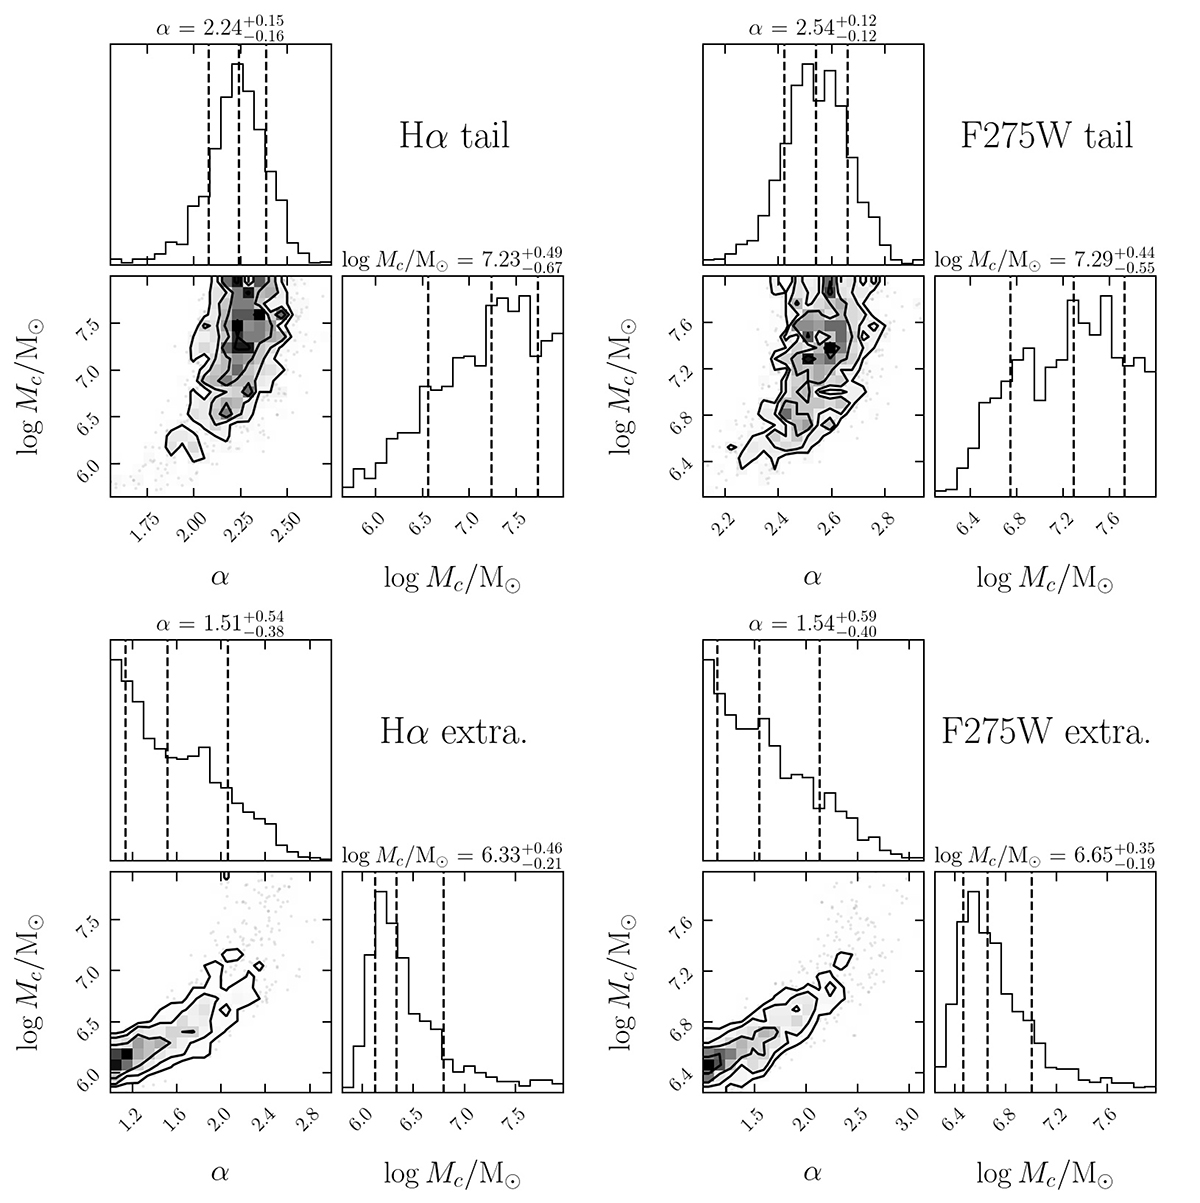
Corner plots of the parameter space (α, log Mc) (the slope and the cut-off mass, respectively), obtained fitting a Schechter mass function (Eq. (8)) to the Hα and UV tail (top row) and extraplanar (bottom row) clump mass distribution. The values at the top of the histograms are the median of each distribution for the corresponding parameter, with uncertainties given by the 84th percentile minus the median and the median minus the 16th percentile (upper and lower uncertainty, respectively). The same values are also reported as black dashed vertical lines in the histograms.
Current usage metrics show cumulative count of Article Views (full-text article views including HTML views, PDF and ePub downloads, according to the available data) and Abstracts Views on Vision4Press platform.
Data correspond to usage on the plateform after 2015. The current usage metrics is available 48-96 hours after online publication and is updated daily on week days.
Initial download of the metrics may take a while.