Fig. 3.
Download original image
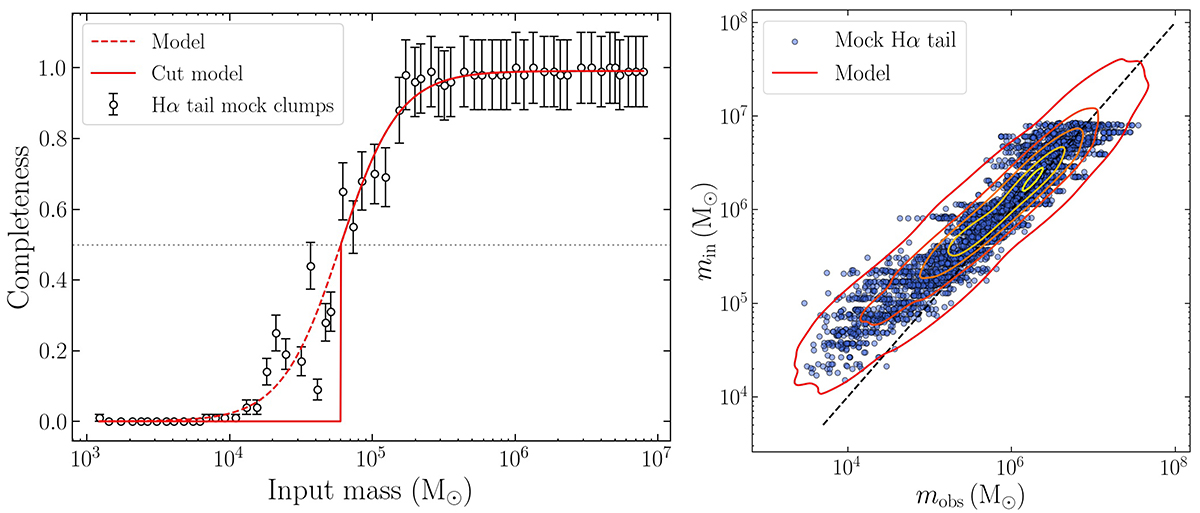
Completeness (left) and mass estimation bias (right) for Hα tail clumps. In the left panel the red solid line is the best-fitting model computed as in Eq. (4), cut to 0 for values below 0.5 (Sect. 3.1), while the red dashed line shows the uncut function. The threshold value of 0.5, below which the function is forced to 0, is plotted as a grey dotted line. The black empty circles show the binned mass completeness derived from the mock clumps (with uncertainties equal to the Poissonian error), for a qualitative visualization of the goodness of the fit (the fitting technique does not depend on the binning). The right panel shows the relationship between the observed (x-axis) and intrinsic (y-axis) mass for the Hα tail re-detected mock clumps. Each clump is plotted as a blue dot. The black dashed line is the 1:1 relation. The red contours are computed from the best-fitting model describing the clumps distribution (Eq. (5)).
Current usage metrics show cumulative count of Article Views (full-text article views including HTML views, PDF and ePub downloads, according to the available data) and Abstracts Views on Vision4Press platform.
Data correspond to usage on the plateform after 2015. The current usage metrics is available 48-96 hours after online publication and is updated daily on week days.
Initial download of the metrics may take a while.