Fig. 13
Download original image
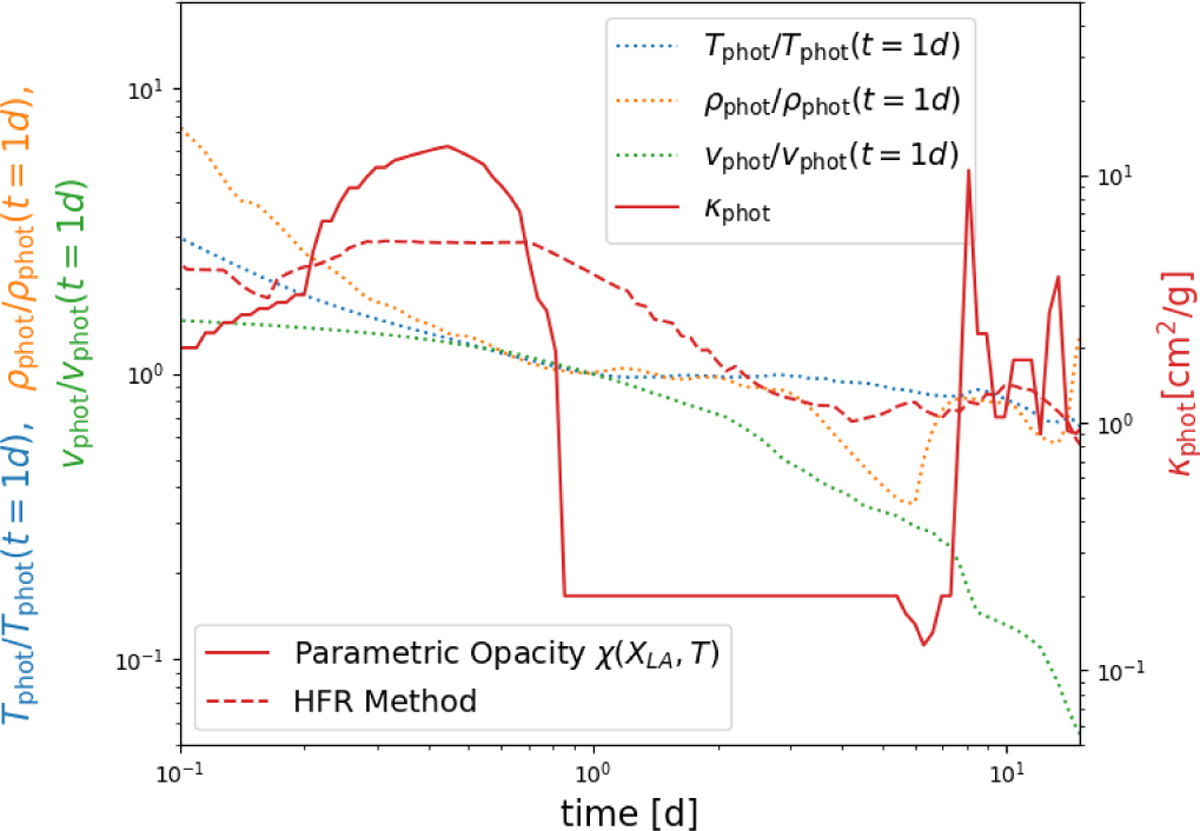
Time evolution of the photospheric properties and the opacity calculated using the HFR method presented in this paper for the NS merger model sym-n1-a6 and assuming a uniform composition corresponding to the full ejecta at t = 3.5 d. Temperature (dotted blue line), density (dotted orange line), and velocity (dotted green line) are scaled by the left y axis and normalized by their values at 1 day. The values at 1 day for these quantities are Tph (t = 1d) = 2750 K, ρph(t = 1d) = 7.4 × 10⁻¹⁶ g cm3, and υph(t = 1d) = 1.2 × 1010 cm s−1, respectively. The Planck-averaged opacity for the HFR data (red, dashed line) is plotted on the right y axis. The solid red curve shows the opacity calculated using the parametric opacity function defined by Just et al. (2022), for comparison.
Current usage metrics show cumulative count of Article Views (full-text article views including HTML views, PDF and ePub downloads, according to the available data) and Abstracts Views on Vision4Press platform.
Data correspond to usage on the plateform after 2015. The current usage metrics is available 48-96 hours after online publication and is updated daily on week days.
Initial download of the metrics may take a while.