Fig. 12
Download original image
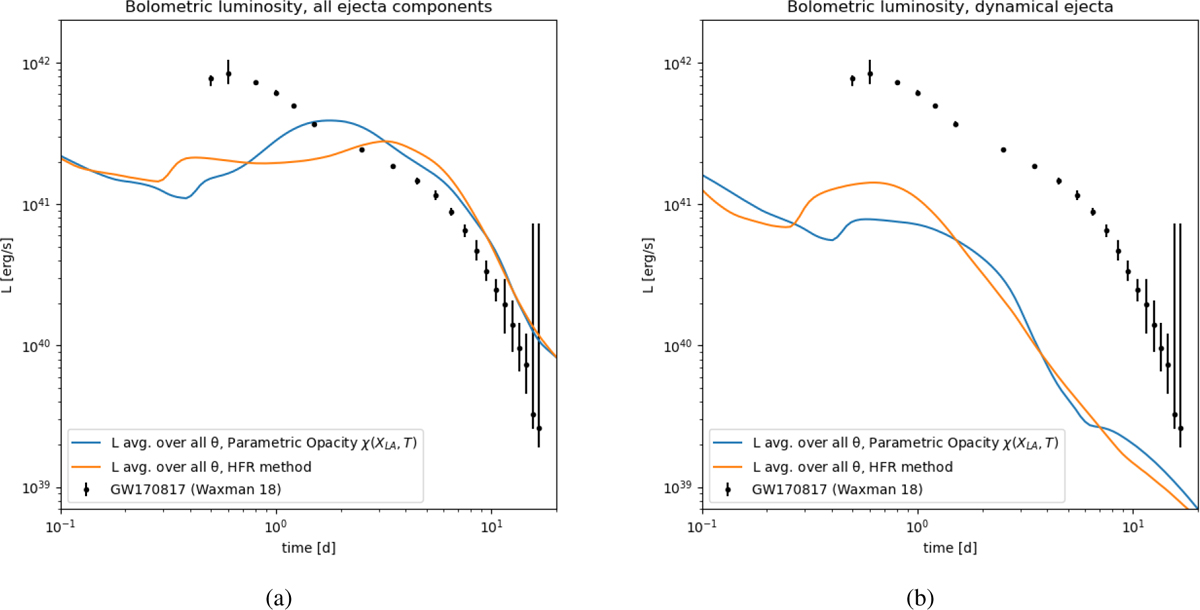
Comparison of light curves obtained with the KN scheme developed in Just et al. (2022) for the NS merger model sym-n1-a6, using a parametric opacity function defined by Just et al. (2022) or the opacity data calculated using the HFR method. The left panel shows the comparison for all the ejecta components including the prompt dynamical component, the ejecta from the NS-torus system, and the disk wind stemming from the black-hole torus remnant; while the right panel shows the comparison for the dynamical ejecta component alone. Note that the computed light curves adopt the simplified assumption of spatially averaged composition. The observed bolometric luminosity of AT2017gfo (Waxman et al. 2018) is shown by solid circles for reference.
Current usage metrics show cumulative count of Article Views (full-text article views including HTML views, PDF and ePub downloads, according to the available data) and Abstracts Views on Vision4Press platform.
Data correspond to usage on the plateform after 2015. The current usage metrics is available 48-96 hours after online publication and is updated daily on week days.
Initial download of the metrics may take a while.