Fig. 8
Download original image
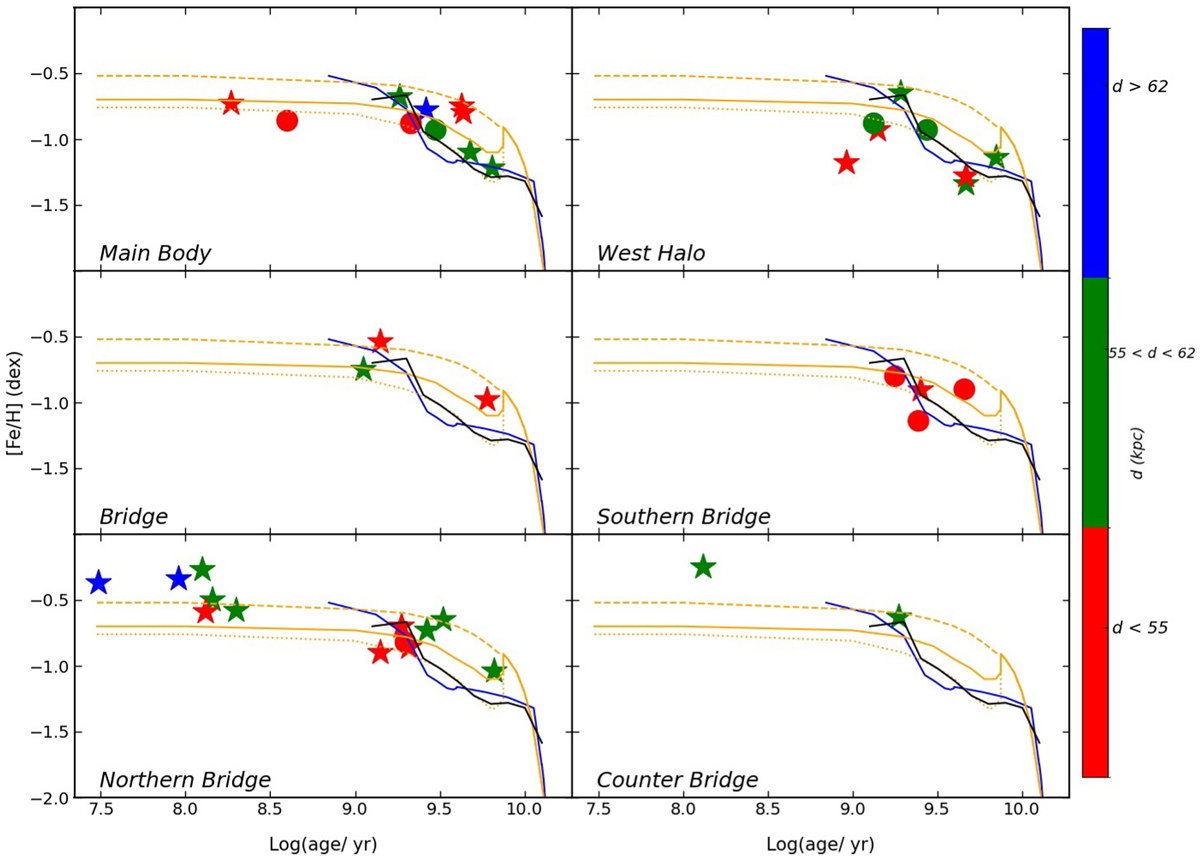
Age-metallicity relationship for different SMC regions. Symbols are as detailed in Fig. 7. Superimposed are the observed age-metallicity relationship of Piatti & Geisler (2013) (black line), and the theoretical ones computed by Pagel & Tautvaisiene (1998) (blue line) and Tsujimoto & Bekki (2009) (orange lines). The dashed and solid orange lines correspond to cases without and with a merger of two similar mass galaxies, respectively.
Current usage metrics show cumulative count of Article Views (full-text article views including HTML views, PDF and ePub downloads, according to the available data) and Abstracts Views on Vision4Press platform.
Data correspond to usage on the plateform after 2015. The current usage metrics is available 48-96 hours after online publication and is updated daily on week days.
Initial download of the metrics may take a while.