Fig. 2
Download original image
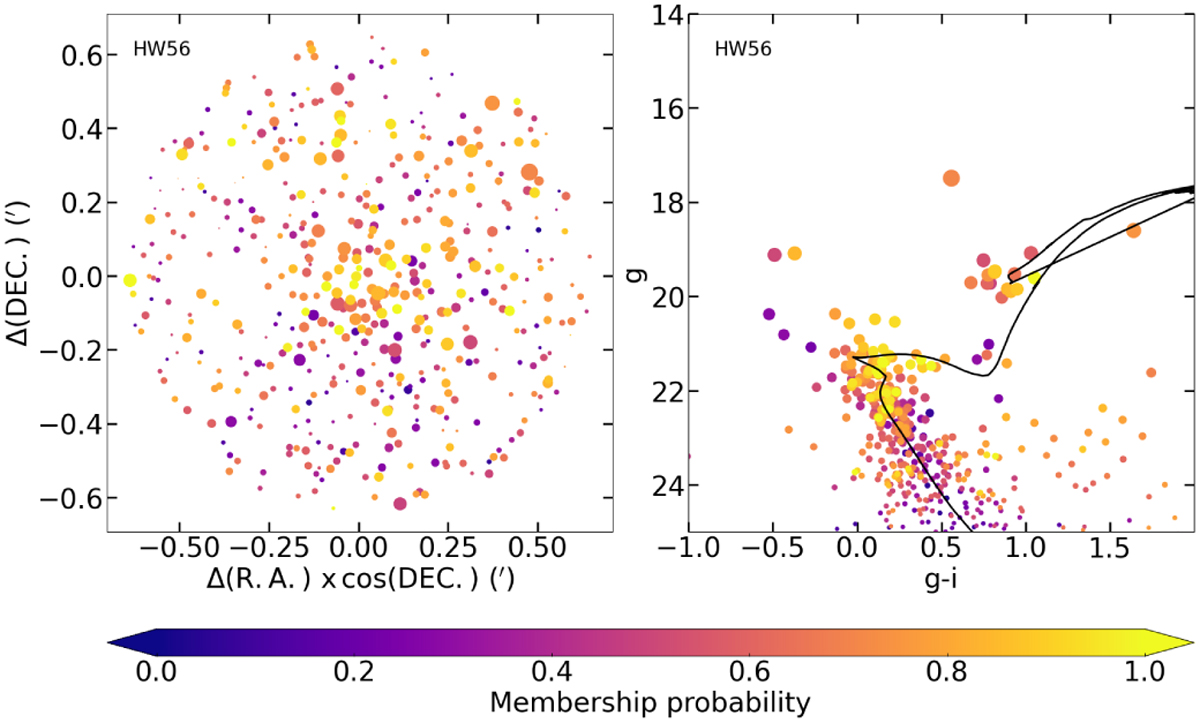
Left: schematic finding chart of HW 56. The sizes of the symbols are proportional to the stars’ brightness. Right: cluster color-magnitude diagram with the theoretical isochrone (Bressan et al. 2012) corresponding to the adopted cluster parameters superimposed (see Table A.2). The color bar indicates the membership probability.
Current usage metrics show cumulative count of Article Views (full-text article views including HTML views, PDF and ePub downloads, according to the available data) and Abstracts Views on Vision4Press platform.
Data correspond to usage on the plateform after 2015. The current usage metrics is available 48-96 hours after online publication and is updated daily on week days.
Initial download of the metrics may take a while.