Open Access
Fig. 5.
Download original image
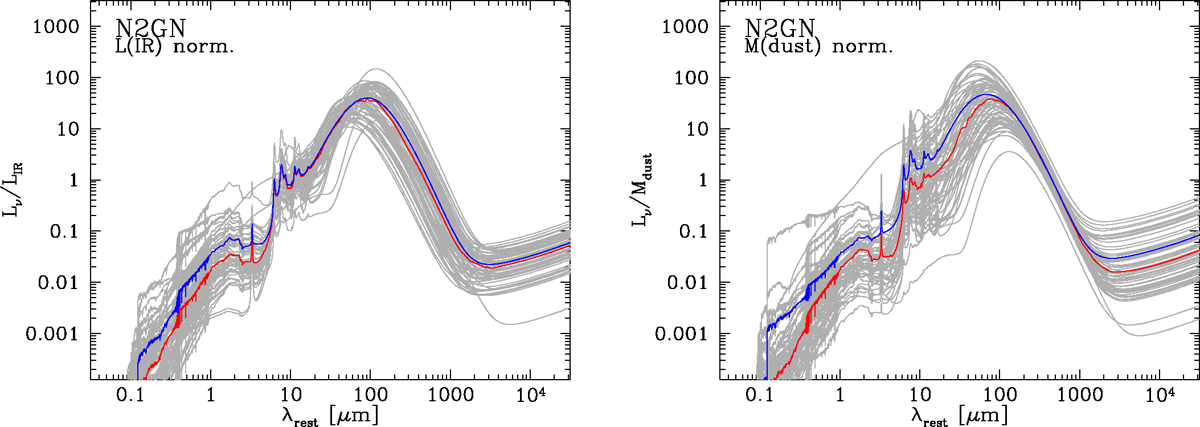
Spectral energy distributions of all N2GN sources obtained with the UV-to-radio SED fitting (gray lines). The red and blue lines represent the median and average SEDs, respectively, as obtained by combining all models.
Current usage metrics show cumulative count of Article Views (full-text article views including HTML views, PDF and ePub downloads, according to the available data) and Abstracts Views on Vision4Press platform.
Data correspond to usage on the plateform after 2015. The current usage metrics is available 48-96 hours after online publication and is updated daily on week days.
Initial download of the metrics may take a while.