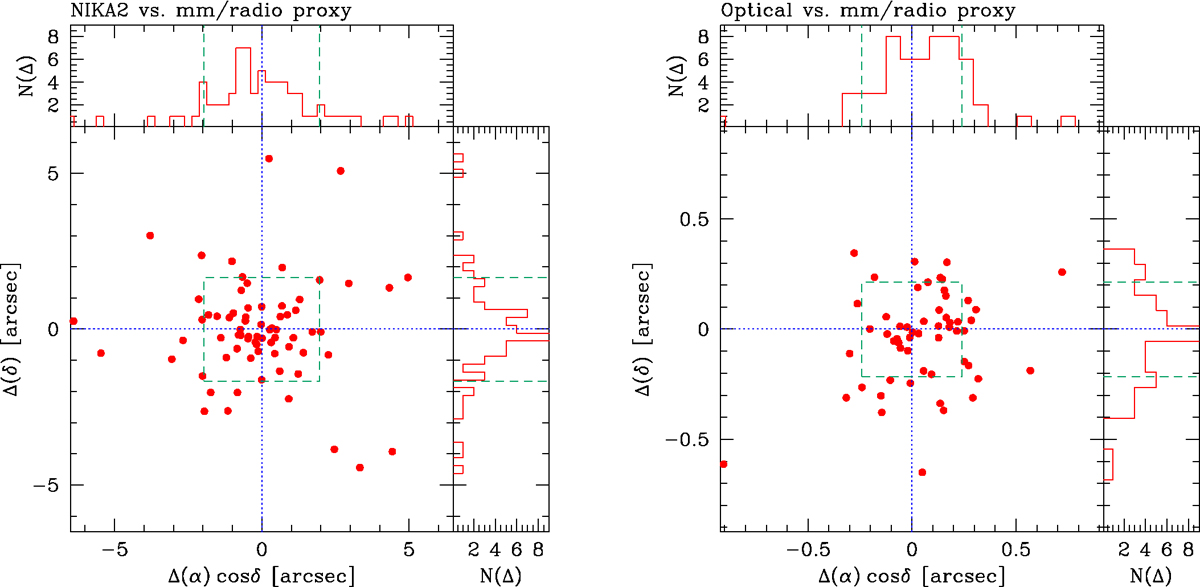
Fig. 3.
Download original image
Differences between the coordinates of the N2GN sources and their counterparts. Left panel: Distance between the NIKA2 coordinates (all from the 1.2 mm position but two) and the matched proxy (Sect. 3.1). Right panel: Distance between the matched proxy and the N2GN optical counterparts. The green dashed lines and boxes mark the rms of the distribution.
Current usage metrics show cumulative count of Article Views (full-text article views including HTML views, PDF and ePub downloads, according to the available data) and Abstracts Views on Vision4Press platform.
Data correspond to usage on the plateform after 2015. The current usage metrics is available 48-96 hours after online publication and is updated daily on week days.
Initial download of the metrics may take a while.