Fig. 6
Download original image
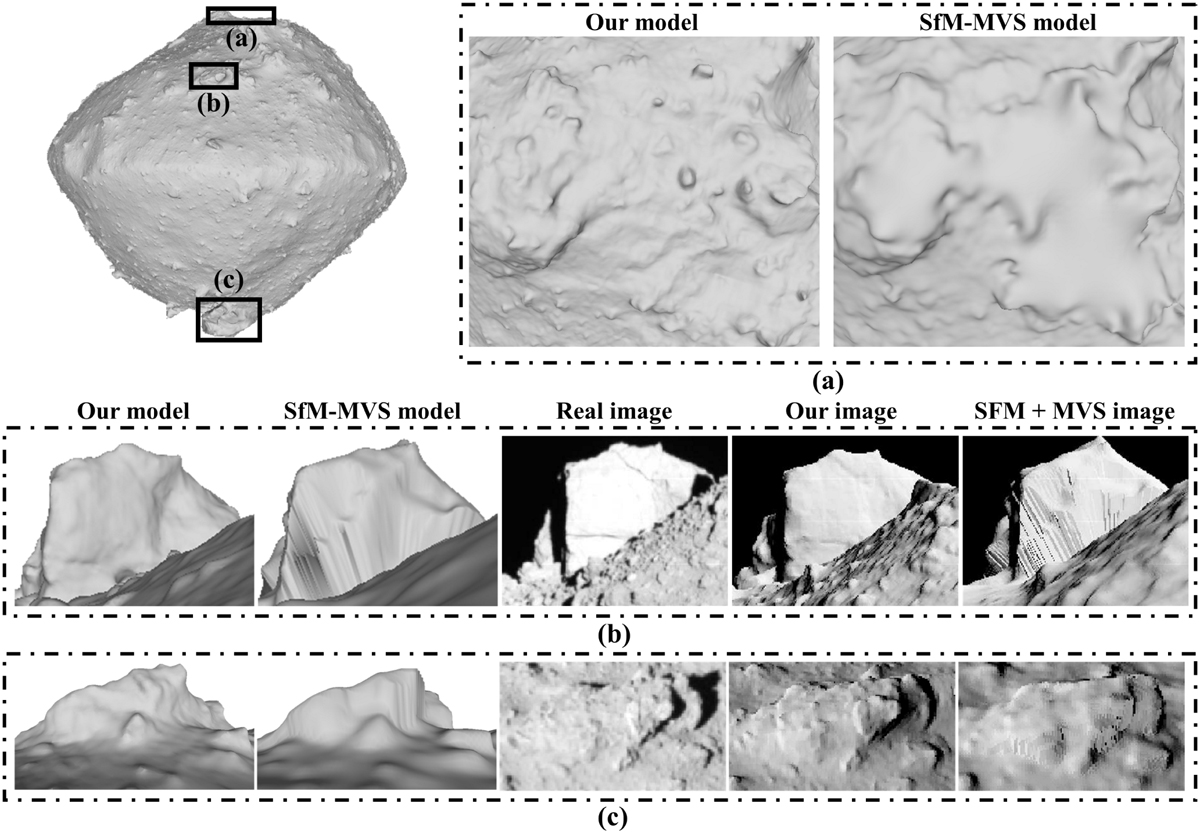
Comparison of reconstruction performance on various boulders in three local areas: (a) our shape model and the SfM-MVS model (Watanabe et al. 2019) in the polar region. (b) and (c) our shape model, the SfM-MVS model, and corresponding synthetic images for two irregularly shaped boulders. The real image for (b) is hyb2_onc_20181030_063616_tvf_12c and for (c) it is hyb2_onc_20180720_105527_tvf_12c.
Current usage metrics show cumulative count of Article Views (full-text article views including HTML views, PDF and ePub downloads, according to the available data) and Abstracts Views on Vision4Press platform.
Data correspond to usage on the plateform after 2015. The current usage metrics is available 48-96 hours after online publication and is updated daily on week days.
Initial download of the metrics may take a while.