Open Access
Fig. 3
Download original image
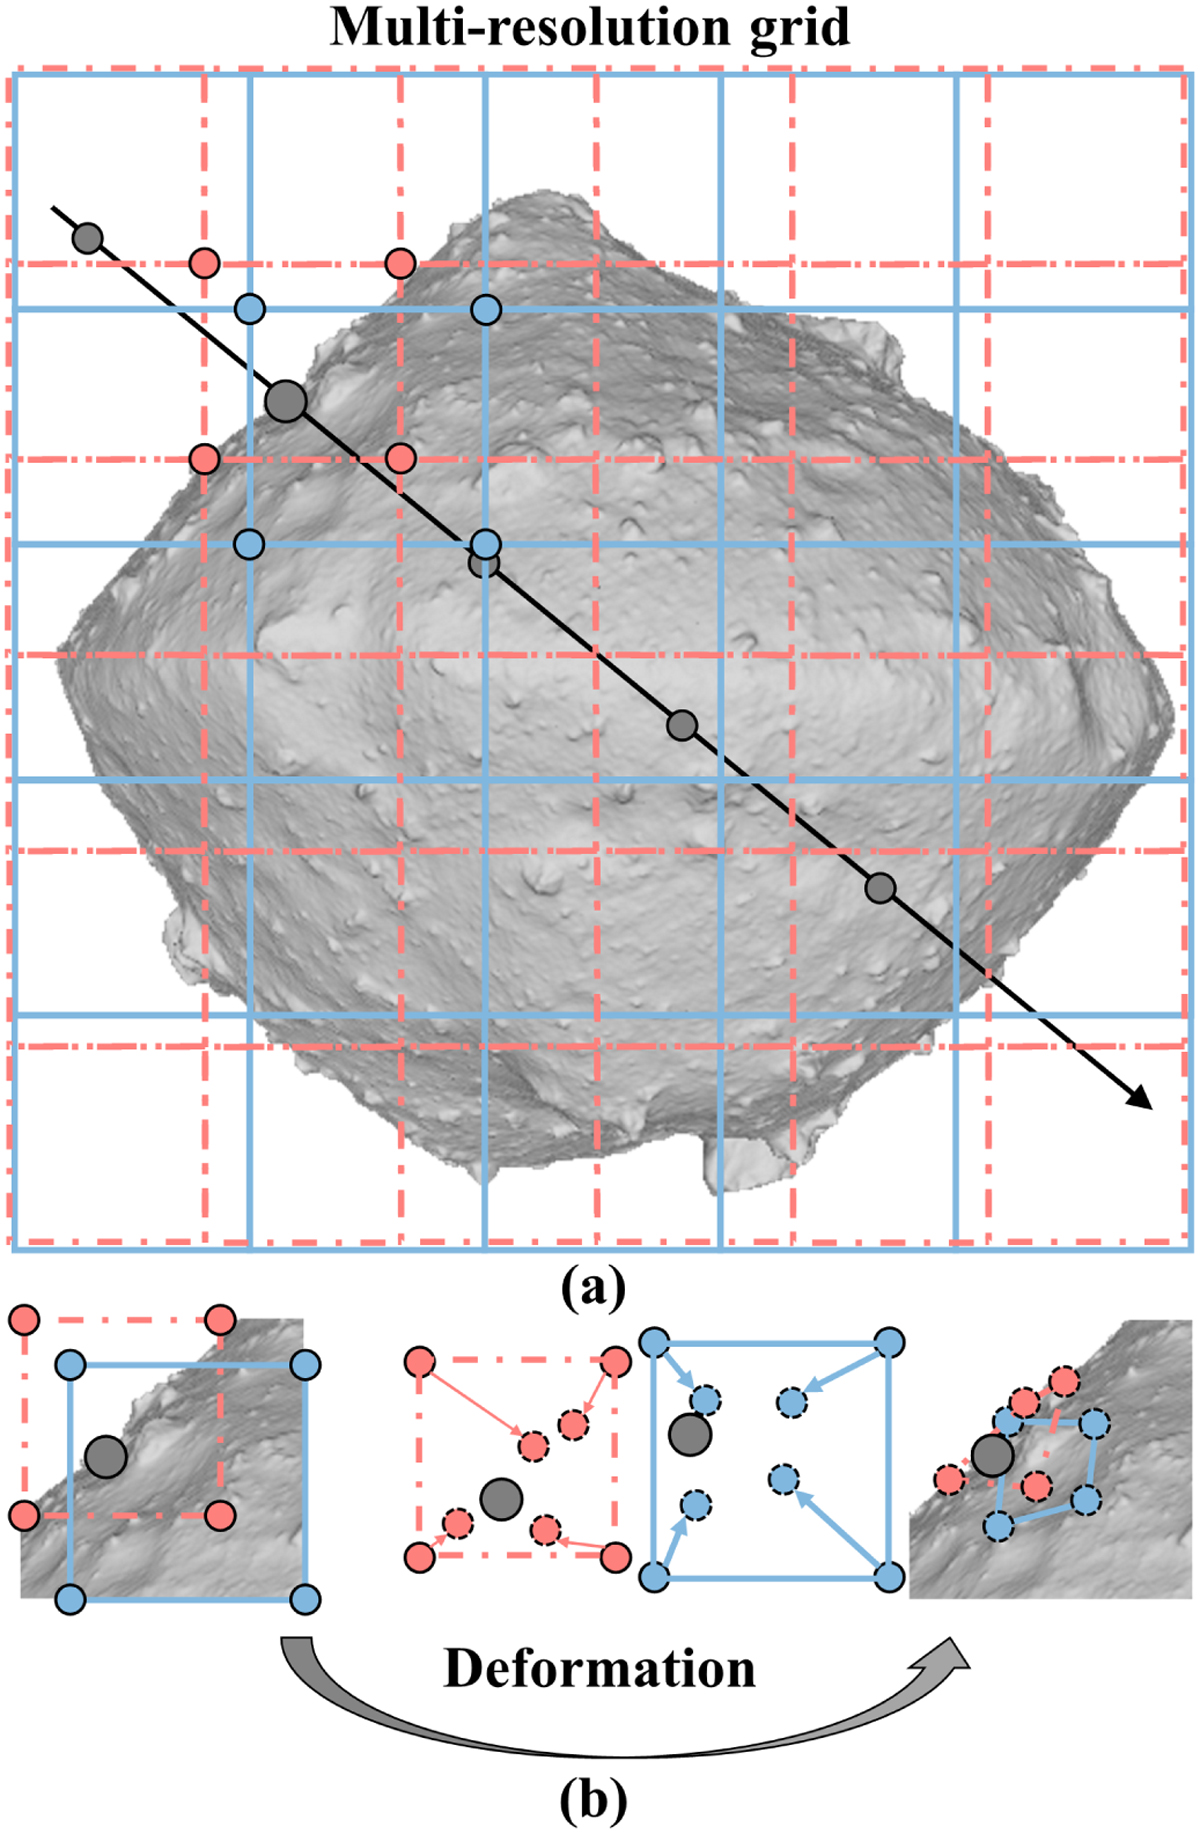
Schematic of multi-resolution deformable grids, displayed in two dimensions with two levels of resolution: (a) depicts the uniformly subdivided grids, while (b) illustrates the deformation process, where vertices adjust their positions from a uniform distribution to a more adaptive arrangement.
Current usage metrics show cumulative count of Article Views (full-text article views including HTML views, PDF and ePub downloads, according to the available data) and Abstracts Views on Vision4Press platform.
Data correspond to usage on the plateform after 2015. The current usage metrics is available 48-96 hours after online publication and is updated daily on week days.
Initial download of the metrics may take a while.