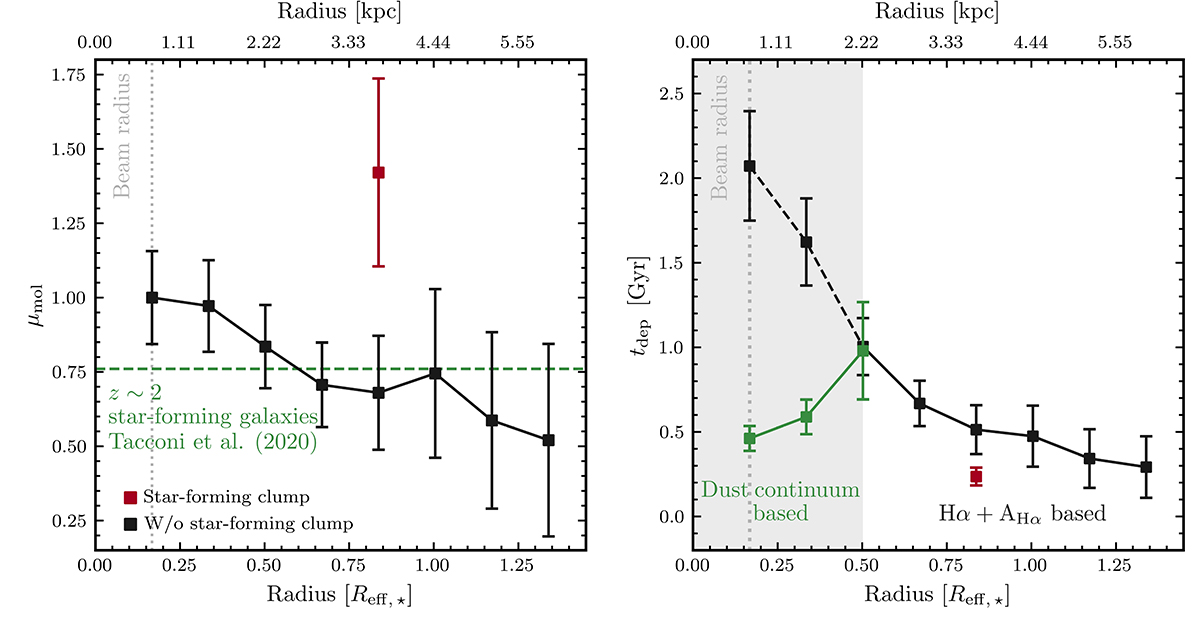
Fig. 4.
Download original image
Radial profiles of the molecular gas fraction (left) and the molecular gas depletion time (right) in BX610. Colors indicate the same as in Figure 3. The vertical gray dotted line indicates the beam radius. In the left panel, the green dashed line indicates the average molecular gas fraction measured by Tacconi et al. (2020) for main-sequence galaxies at z ∼ 2.
Current usage metrics show cumulative count of Article Views (full-text article views including HTML views, PDF and ePub downloads, according to the available data) and Abstracts Views on Vision4Press platform.
Data correspond to usage on the plateform after 2015. The current usage metrics is available 48-96 hours after online publication and is updated daily on week days.
Initial download of the metrics may take a while.