Fig. 3.
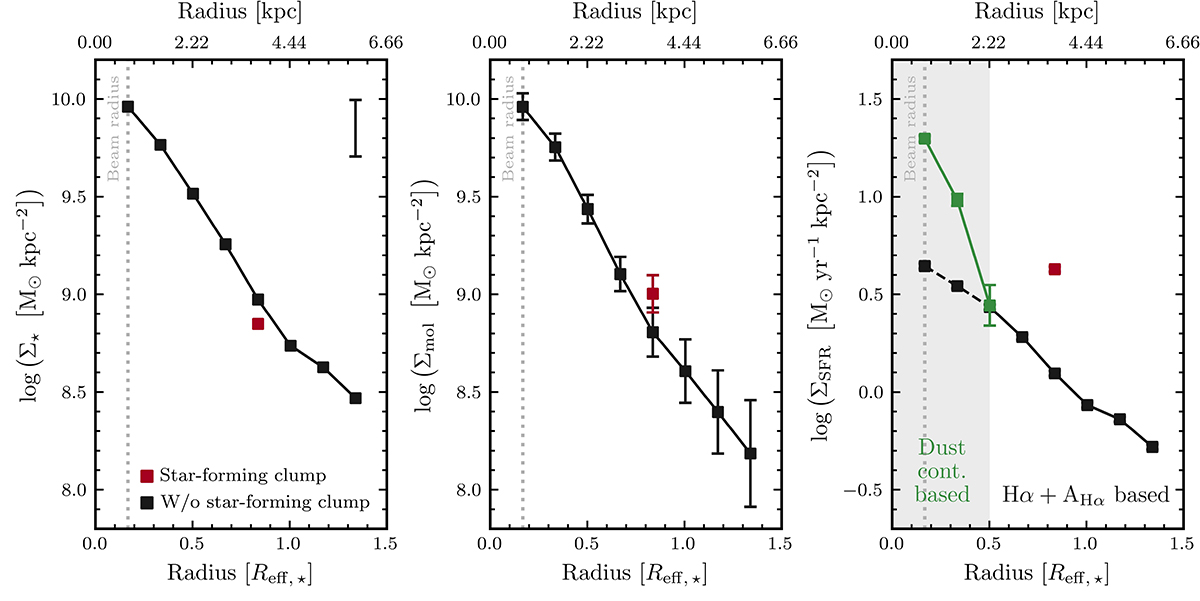
Download original image
Radial profiles of the stellar mass (left), molecular gas mass (middle), and SFR (right) surface densities of BX610, plotted with the same logarithmic dynamic range to facilitate comparison. Colors indicate the same as in Figure 2. In the right panel, green squares above the gray-shaded area are derived from the rest-frame 630 μm dust continuum emission, while black squares outside the area are derived from Hα corrected by dust attenuation profile of Tacchella et al. (2018). We also indicate for comparison the ΣSFR(Hα) data in the central region as black-filled squares, but with a dashed line. The vertical gray dotted line indicates the beam radius. We observe in the central region of the right panel that the SFRHα surface density is clearly underestimated in comparison with the SFRdust surface density.
Current usage metrics show cumulative count of Article Views (full-text article views including HTML views, PDF and ePub downloads, according to the available data) and Abstracts Views on Vision4Press platform.
Data correspond to usage on the plateform after 2015. The current usage metrics is available 48-96 hours after online publication and is updated daily on week days.
Initial download of the metrics may take a while.