Fig. 2.
Download original image
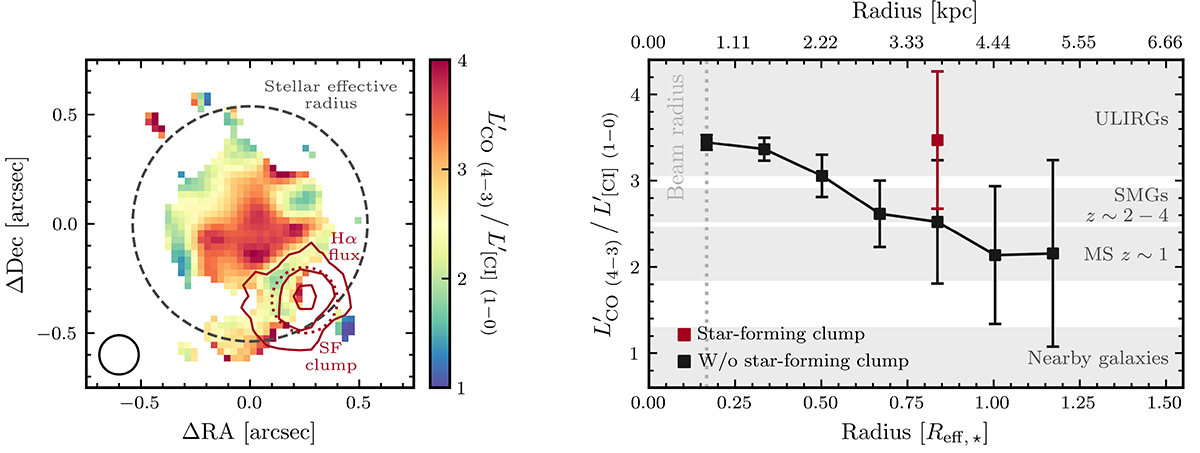
Left: ![]() line luminosity ratio map. The galaxy’s stellar effective radius is shown as the dashed gray circle. The red solid contours correspond to Hα fractional flux levels relative to the maximum of 0.5, 0.75, and 0.95, while the red dotted contour denotes the position of the star-forming clump. The filled circle at the bottom left corner indicates the beam size. Right: radial profile of the
line luminosity ratio map. The galaxy’s stellar effective radius is shown as the dashed gray circle. The red solid contours correspond to Hα fractional flux levels relative to the maximum of 0.5, 0.75, and 0.95, while the red dotted contour denotes the position of the star-forming clump. The filled circle at the bottom left corner indicates the beam size. Right: radial profile of the ![]() line luminosity ratio. The radial distance from the center is normalized by the galaxy’s stellar effective radius. The black squares with error bars show the mean value of the line luminosity ratio within each beam-sized bin, without considering the emission of the clump. The red square with the error bar shows the mean value of the line luminosity ratio within the clump. The gray-shaded areas are typical line luminosity ratio values, taken from the literature (e.g., Papadopoulos & Geach 2012; Valentino et al. 2020). The vertical gray dotted line indicates the beam radius. We observe that the mean value in the central region is comparable to that of local ULIRGs, as well as the mean value in the star-forming clump, while the mean value in the outer disk is comparable to that of the main-sequence galaxies at z ∼ 1.
line luminosity ratio. The radial distance from the center is normalized by the galaxy’s stellar effective radius. The black squares with error bars show the mean value of the line luminosity ratio within each beam-sized bin, without considering the emission of the clump. The red square with the error bar shows the mean value of the line luminosity ratio within the clump. The gray-shaded areas are typical line luminosity ratio values, taken from the literature (e.g., Papadopoulos & Geach 2012; Valentino et al. 2020). The vertical gray dotted line indicates the beam radius. We observe that the mean value in the central region is comparable to that of local ULIRGs, as well as the mean value in the star-forming clump, while the mean value in the outer disk is comparable to that of the main-sequence galaxies at z ∼ 1.
Current usage metrics show cumulative count of Article Views (full-text article views including HTML views, PDF and ePub downloads, according to the available data) and Abstracts Views on Vision4Press platform.
Data correspond to usage on the plateform after 2015. The current usage metrics is available 48-96 hours after online publication and is updated daily on week days.
Initial download of the metrics may take a while.