Fig. 1.
Download original image
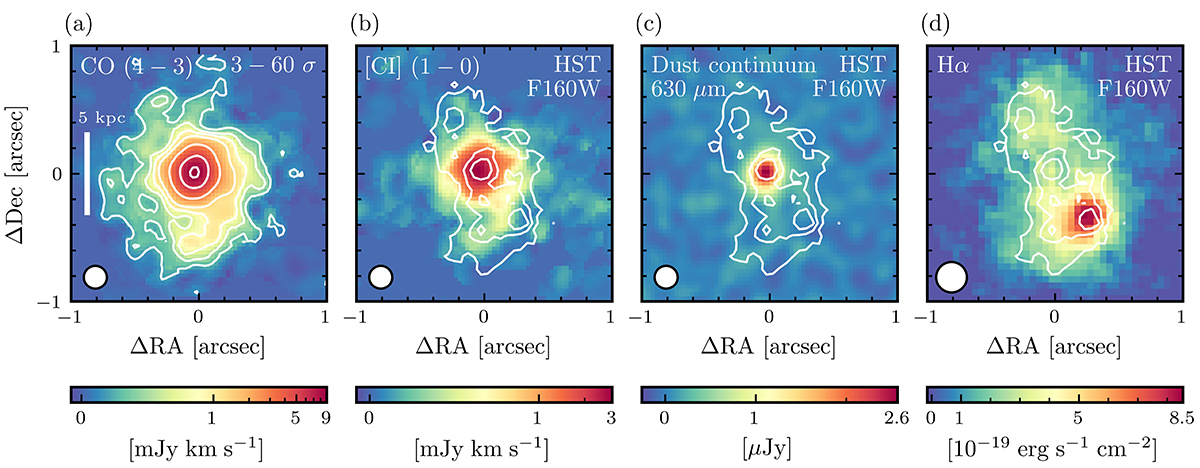
Multi-wavelength imaging of BX610. (a) CO (4–3) integrated intensity map. The overlaid white contours correspond to the 3, 5, 7, 10, 20, 40, and 60σ levels. The filled circle at the bottom left corner indicates the ALMA-synthesized beam (θ = 0.18″ × 0.18″). (b) [CI] (1–0) integrated intensity map. The overlaid white contours, as in panels (c) and (d), represent the rest-frame optical emission observed by HST NICMOS/NIC2 F160W, corresponding to fractional flux levels relative to the maximum of 0.25, 0.5, and 0.75. (c) Rest-frame 630 μ m dust continuum emission. (d) Hα integrated intensity map. The filled circle at the bottom left corner indicates the SINFONI Hα point-spread function (θ = 0.24″ × 0.24″).
Current usage metrics show cumulative count of Article Views (full-text article views including HTML views, PDF and ePub downloads, according to the available data) and Abstracts Views on Vision4Press platform.
Data correspond to usage on the plateform after 2015. The current usage metrics is available 48-96 hours after online publication and is updated daily on week days.
Initial download of the metrics may take a while.