Fig. 3.
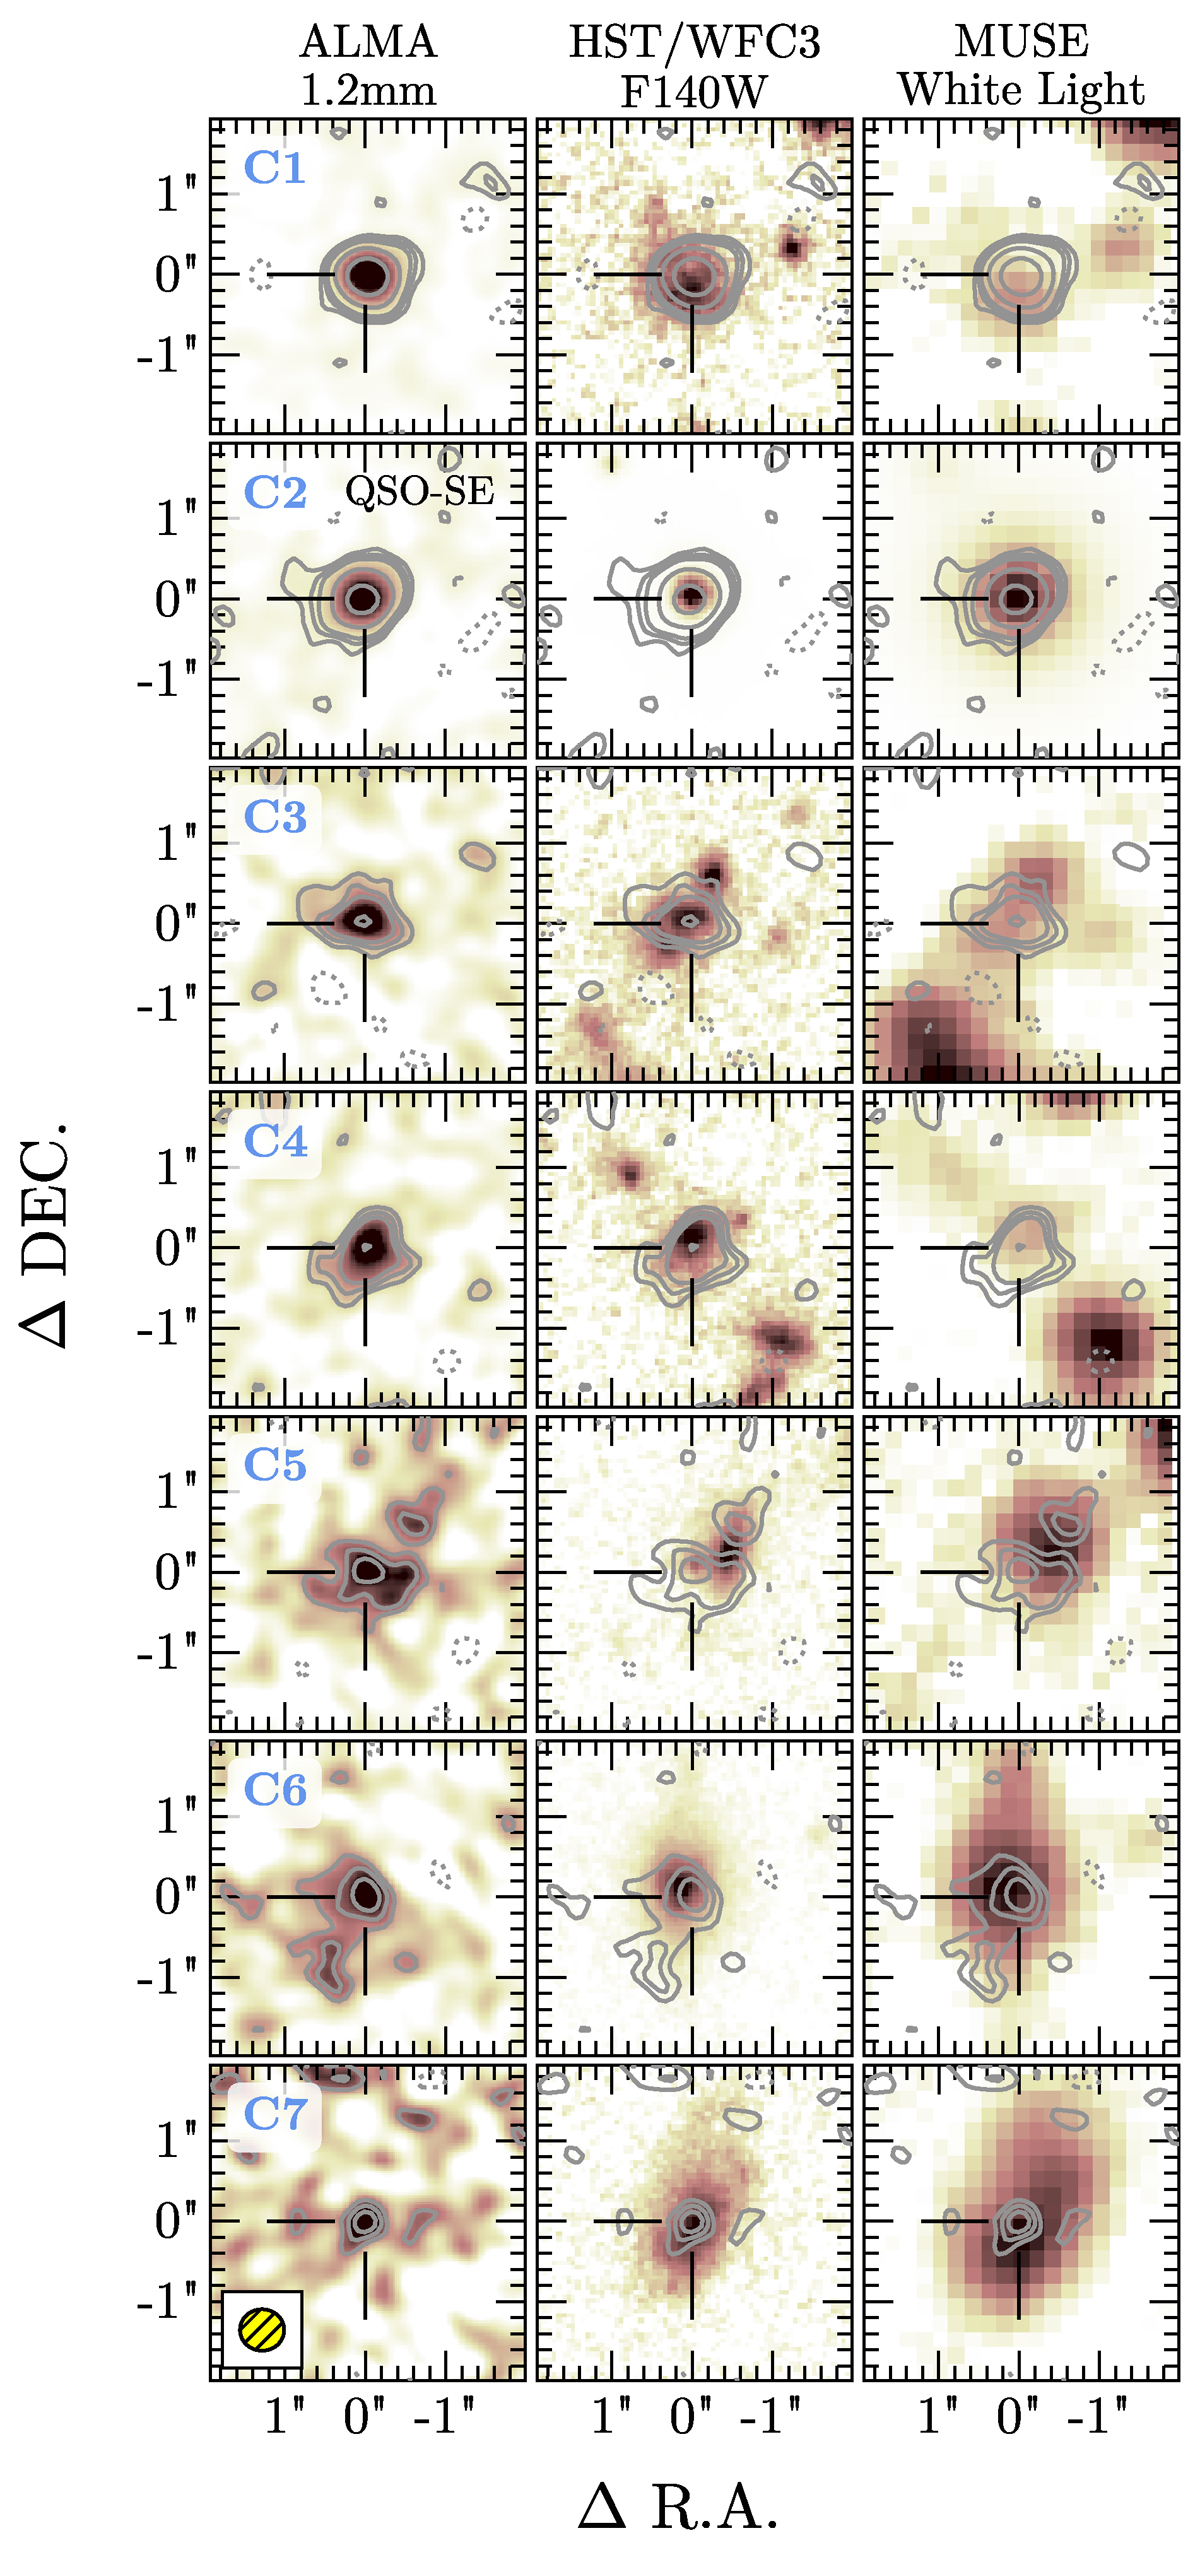
Download original image
5″×5″ postage stamps of NIR and optical/NUV counterparts of ALMA 1.2-mm continuum-selected sources in the MUDF. From left to right: 1.2-mm continuum map from ALMA band 6, HST/WFC3 F140W (central observed wavelength 1.4 μm), MUSE white light image (central observed wavelength 655 nm). The solid contours show the [2, 3, 2n]×RMS (with n≥2) levels of the ALMA continuum. The yellow ellipse at the corner of the bottom left panel shows the synthesized ALMA beam.
Current usage metrics show cumulative count of Article Views (full-text article views including HTML views, PDF and ePub downloads, according to the available data) and Abstracts Views on Vision4Press platform.
Data correspond to usage on the plateform after 2015. The current usage metrics is available 48-96 hours after online publication and is updated daily on week days.
Initial download of the metrics may take a while.