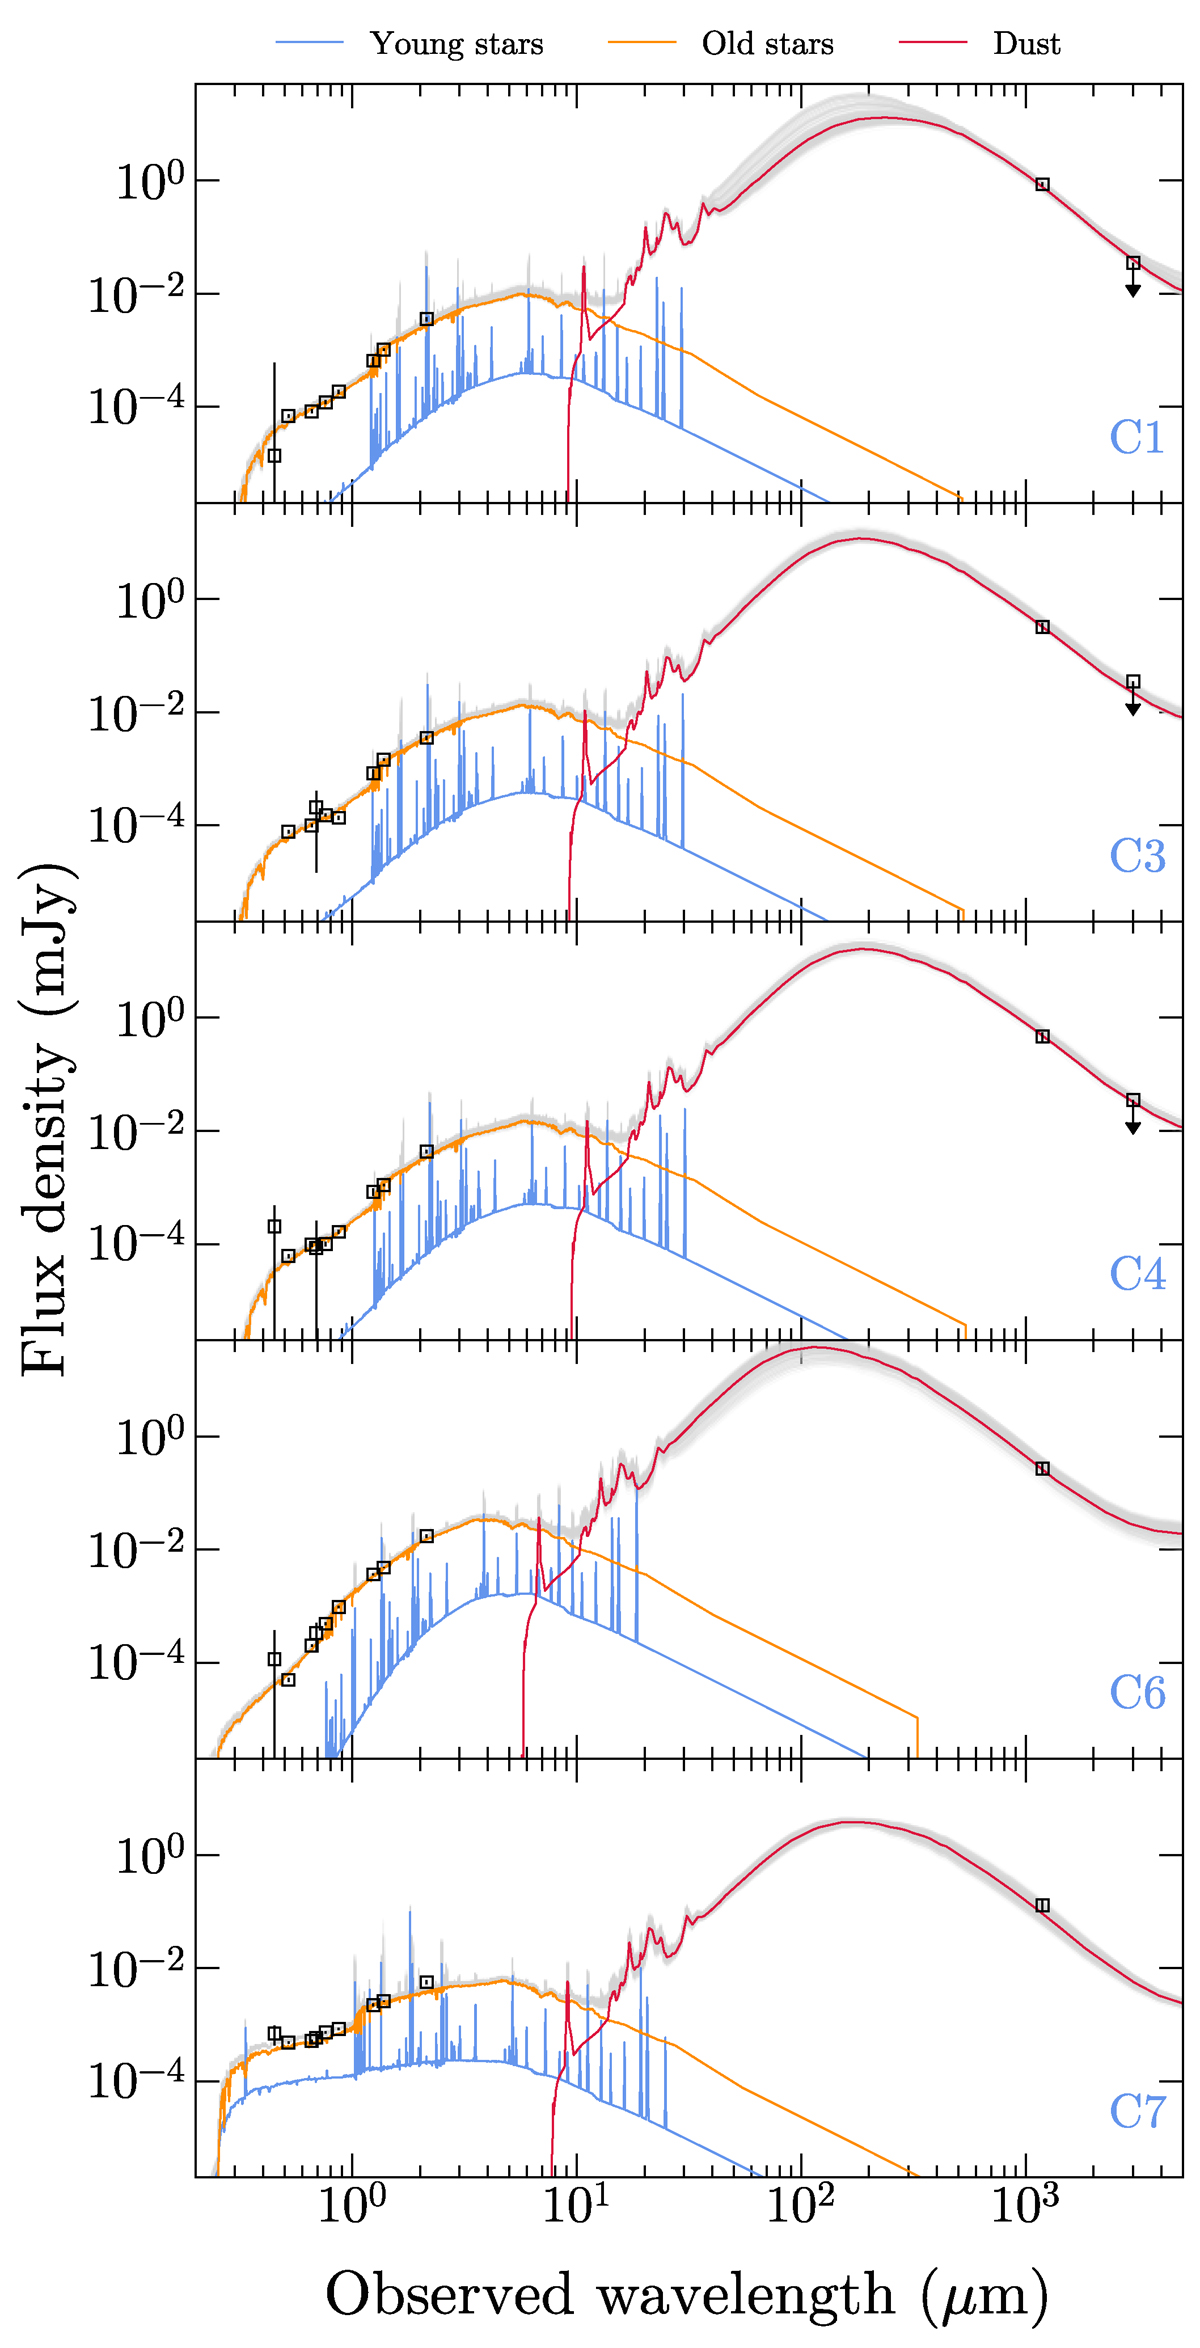
Fig. A.1.
Download original image
Best fit SED models of ALMA-selected galaxies. The black squares report the multiband photometric data. Flux upper limits at 5-σ for C1, C3, and C4, obtained from 3-mm continuum images are also reported. Red, blue, and orange lines represent the dust emission, and the young (star age <10 Myr) and old (>10 Myr) stellar components, respectively. The gray lines show random extraction from the posterior probability distribution of the total galaxy SED.
Current usage metrics show cumulative count of Article Views (full-text article views including HTML views, PDF and ePub downloads, according to the available data) and Abstracts Views on Vision4Press platform.
Data correspond to usage on the plateform after 2015. The current usage metrics is available 48-96 hours after online publication and is updated daily on week days.
Initial download of the metrics may take a while.