Fig. 5
Download original image
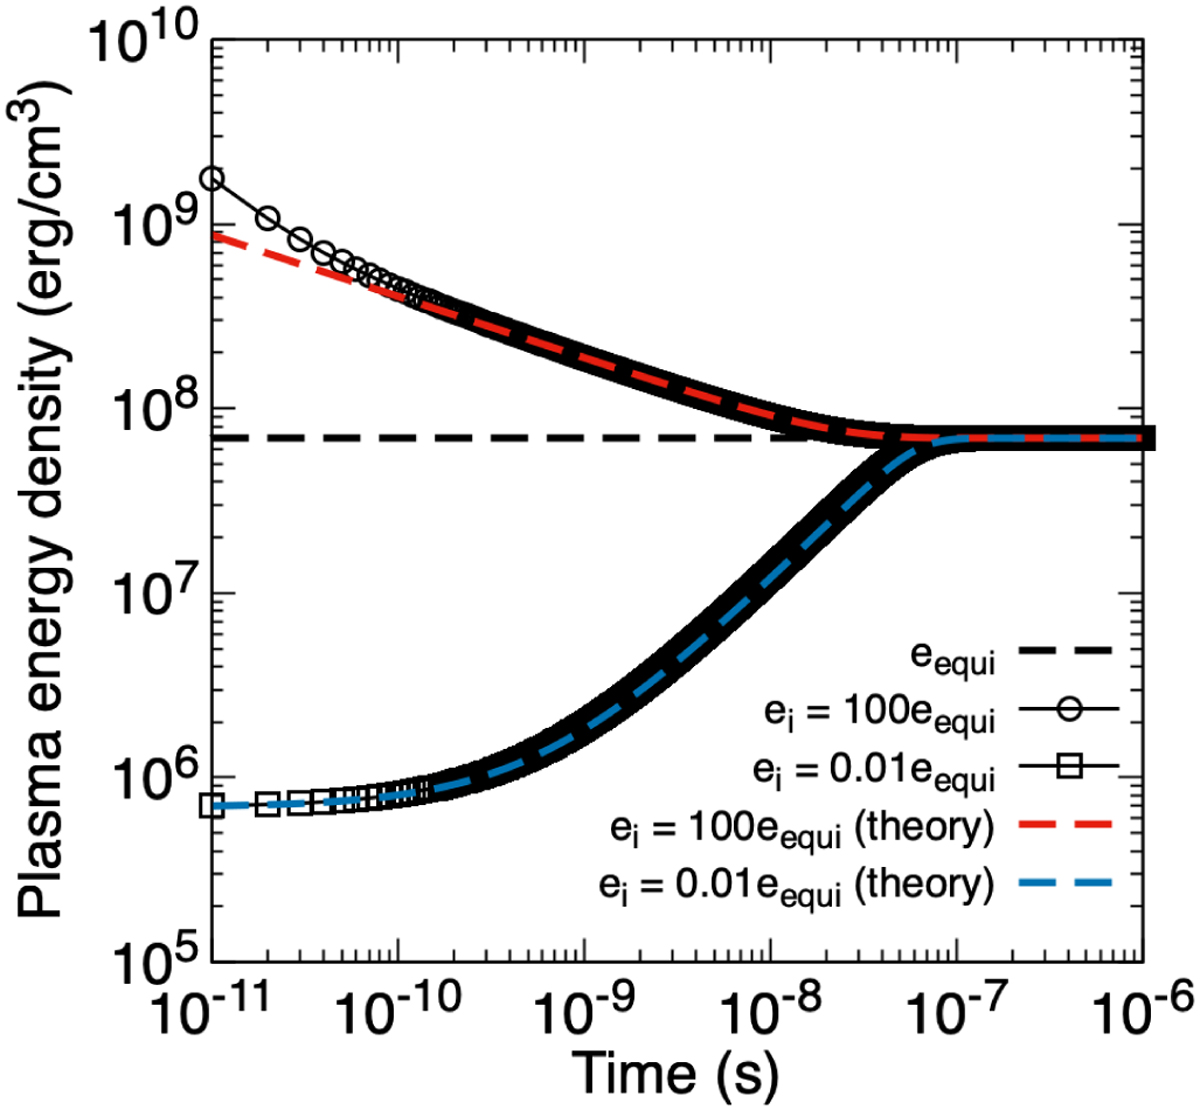
Time evolution of plasma energy density for a plasma initialized with ei = 102eequi (cooling) and ei = 10−2eequi (heating). The red and blue dashed lines are the semi-analytical solutions for the cooling and heating cases, respectively. The black dashed line shows the equilibrium plasma thermal energy. Due to the logarithmic scaling of the time axis, the initial conditions at t = 0 are not seen here.
Current usage metrics show cumulative count of Article Views (full-text article views including HTML views, PDF and ePub downloads, according to the available data) and Abstracts Views on Vision4Press platform.
Data correspond to usage on the plateform after 2015. The current usage metrics is available 48-96 hours after online publication and is updated daily on week days.
Initial download of the metrics may take a while.