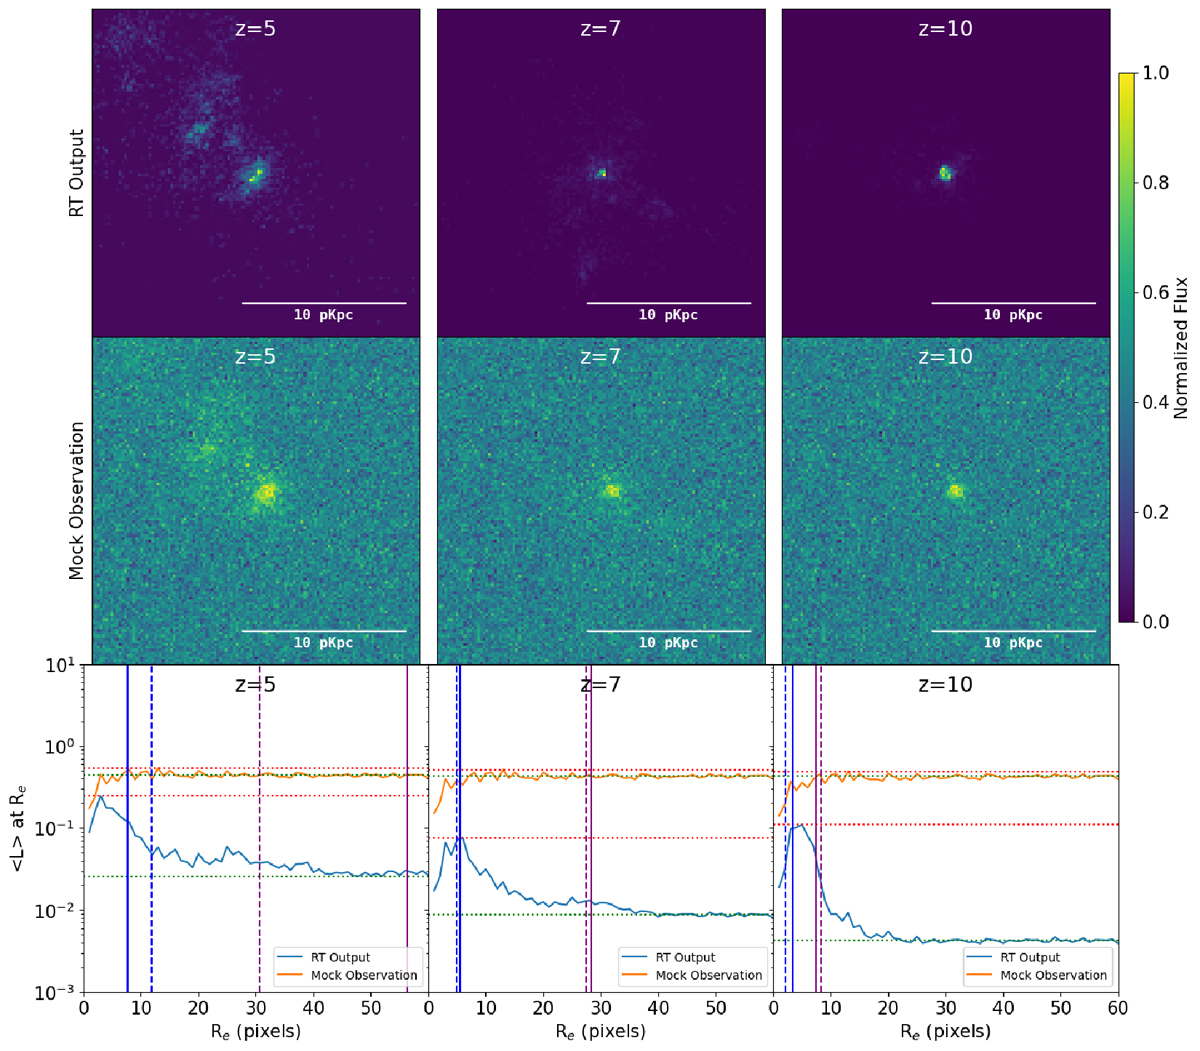
Fig. 6.
Download original image
Brightness comparison between original and noisy image is shown for a sample redshift 5, 7 & 10 galaxies with size offset at S/N =5. The bottom row shows the mean luminosity of pixels at each radius (y-axis) calculated by finding pixel luminosities at the edge of the aperture and dividing it by circumference) plotted against the radius (x-axis) for the normalised images. The centre for these luminosities is assumed as the centre of potential as defined in the simulations. The red lines indicate the maximum brightness and the green line shows the median brightness. The blue solid and dashed lines show the r20 of original and noisy image respectively. The purple solid and dashed lines show the r80 of original and noisy images respectively. Panel for z = 5 shows the case of underestimation, z = 7 of near parity and z = 10 shows an overestimation.
Current usage metrics show cumulative count of Article Views (full-text article views including HTML views, PDF and ePub downloads, according to the available data) and Abstracts Views on Vision4Press platform.
Data correspond to usage on the plateform after 2015. The current usage metrics is available 48-96 hours after online publication and is updated daily on week days.
Initial download of the metrics may take a while.