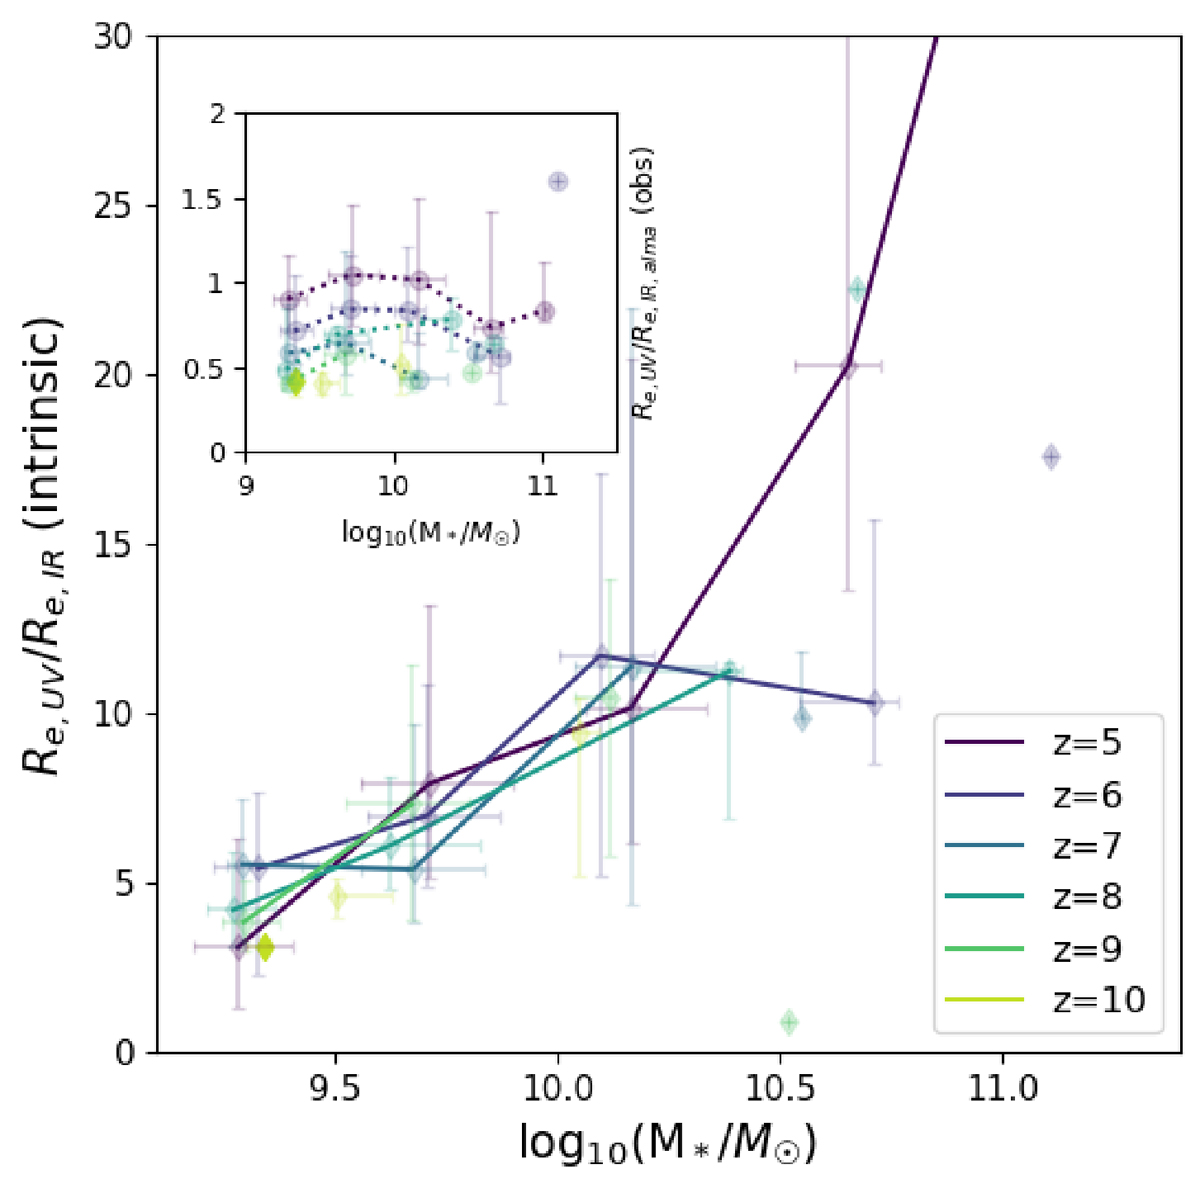
Fig. 16.
Download original image
Ratio of intrinsic sizes (main figure) as well mock observations (inset figure) at 1500 Å with observations like ALMA configuration is shown for UV and IR spectrum in stellar mass bins of 0.5 dex, with median values plotted as data-points. The error bars denote the 16th and 84th percentile values. Only sufficiently populated bins (N > 20) have been used to plot the lines.
Current usage metrics show cumulative count of Article Views (full-text article views including HTML views, PDF and ePub downloads, according to the available data) and Abstracts Views on Vision4Press platform.
Data correspond to usage on the plateform after 2015. The current usage metrics is available 48-96 hours after online publication and is updated daily on week days.
Initial download of the metrics may take a while.