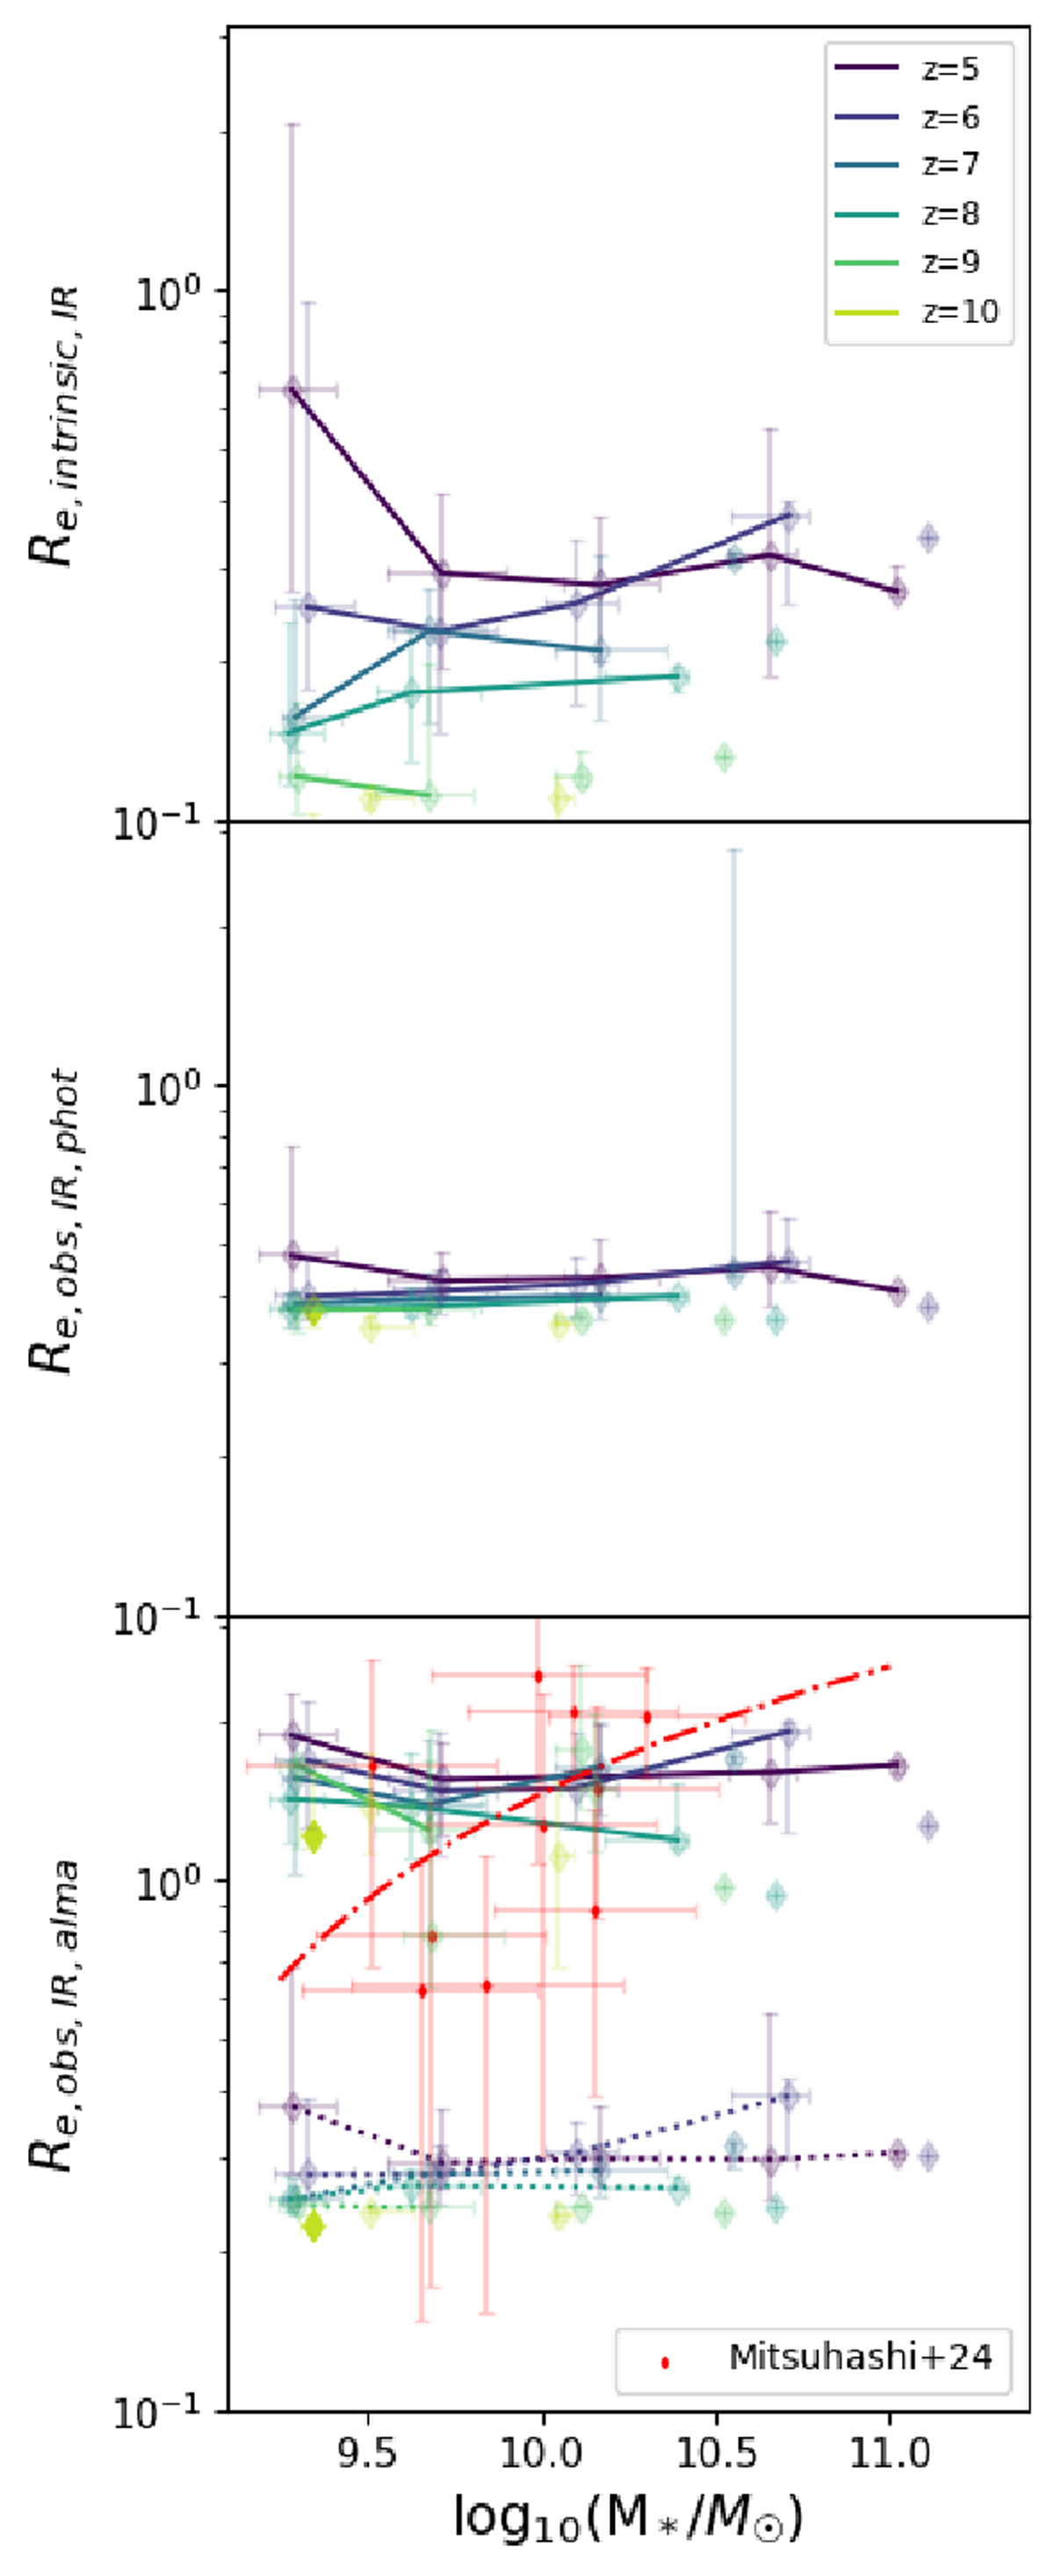
Fig. 14.
Download original image
Upper panel: Median intrinsic sizes(y-axis) of 50 μm in simulations as a function of stellar mass(x-axis) are shown. Middle panel: Evolution of mock IR photometric observational sizes at S/N =5. Lower panel: Evolution of ALMA observed sizes. The (≈0.01 − 0.02′′) angular resolution sizes are represented by the dotted lines and the low angular resolution (≈0.3′′) sizes are represented by the solid lines. The red scatter and the corresponding line show the CRISTAL Mitsuhashi et al. (2024) data and its best fit mass-size relation respectively.
Current usage metrics show cumulative count of Article Views (full-text article views including HTML views, PDF and ePub downloads, according to the available data) and Abstracts Views on Vision4Press platform.
Data correspond to usage on the plateform after 2015. The current usage metrics is available 48-96 hours after online publication and is updated daily on week days.
Initial download of the metrics may take a while.