Fig. 11.
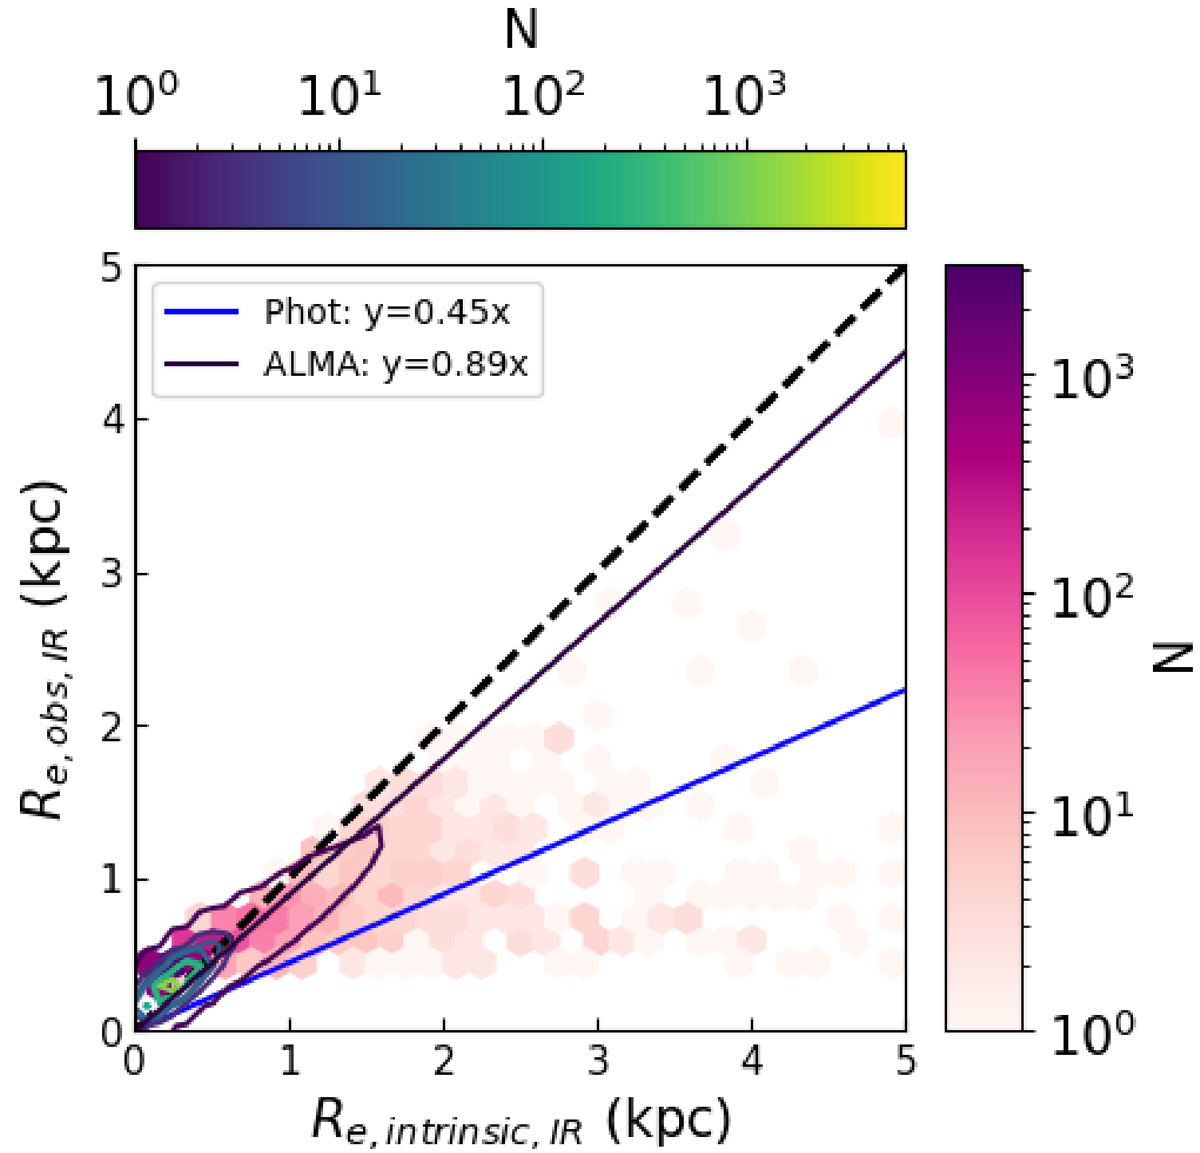
Download original image
Comparison of sizes between various IR observation methods is shown above. The plot compares IR sizes (y-axis) from mock photometry (50 μm) and ALMA simulations (high-resolution, ≈0.01 − 0.02′′ at 156 μm) with intrinsic sizes (50 μm) (x-axis). The hex-bin plot shows the log mapped distribution of photometric sizes whereas the contours show the log mapped distribution of mock ALMA sizes. The black line shows the 1:1 relation with the yellow line showing the best-fit y = mx relation. All ALMA sizes in this plot of high angular resolution (≈0.01′′ angular resolution).
Current usage metrics show cumulative count of Article Views (full-text article views including HTML views, PDF and ePub downloads, according to the available data) and Abstracts Views on Vision4Press platform.
Data correspond to usage on the plateform after 2015. The current usage metrics is available 48-96 hours after online publication and is updated daily on week days.
Initial download of the metrics may take a while.