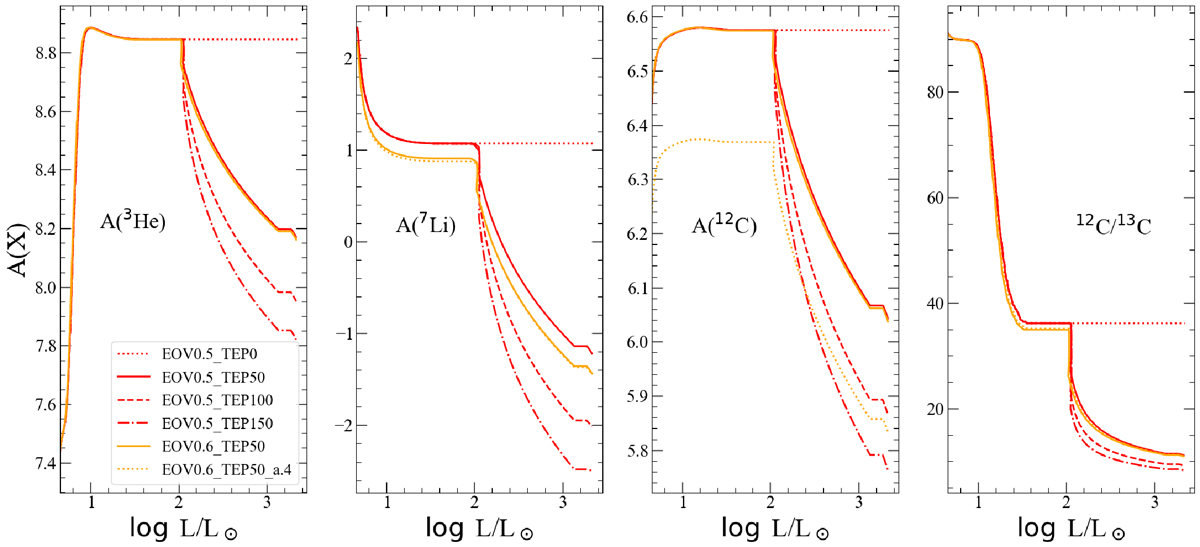
Fig. 4.
Download original image
Comparison between different models of the variation surface abundances of 3He, 7Li, 12C, and C-isotopes ratio. The models with different values of Λe = 0.5, 0.6, and αth = 0, 50, 100, 150 by using solar-scaled and [α/Fe] = 0.4 mixtures are shown according to the indicated labels. For simplicity, only the evolution during the red giant phase is shown here.
Current usage metrics show cumulative count of Article Views (full-text article views including HTML views, PDF and ePub downloads, according to the available data) and Abstracts Views on Vision4Press platform.
Data correspond to usage on the plateform after 2015. The current usage metrics is available 48-96 hours after online publication and is updated daily on week days.
Initial download of the metrics may take a while.