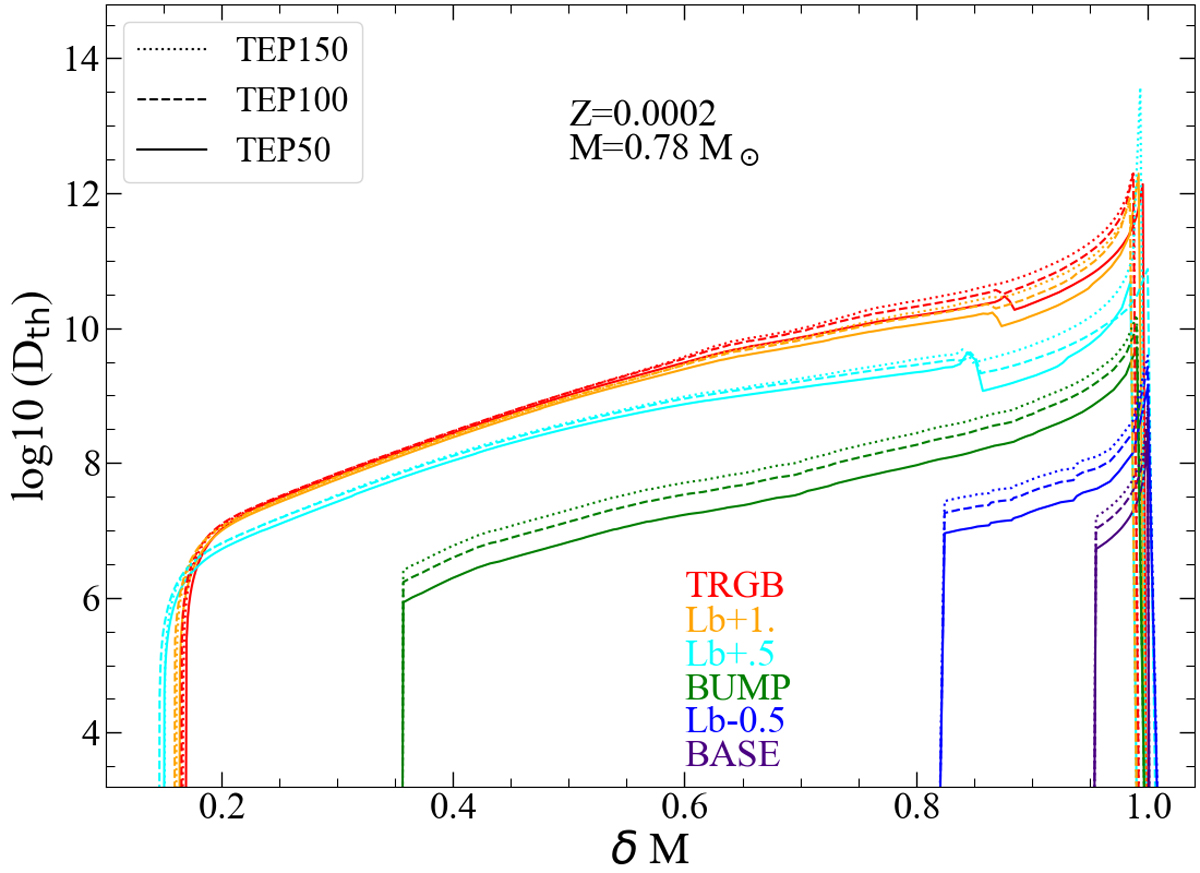
Fig. 2.
Download original image
Variation of thermohaline diffusion coefficient within the radiative region, at five typical stages along the evolution of a selected star, 0.78 M⊙. The x-axis is the relative mass in Eq. (4). Models with different thermohaline efficiency parameters, αth = 50, 100, 150, (referred to as ‘TEP’) are displayed with different line styles, while colours indicate the five stages: at the base of the RGB (BASE), 0.5 dex below the bump’s luminosity (Lb-0.5), at the bump’s luminosity (BUMP), 0.5 dex above the bump (Lb+0.5), 1 dex above the bump (Lb+1), and at the tip of the RGB (TRGB).
Current usage metrics show cumulative count of Article Views (full-text article views including HTML views, PDF and ePub downloads, according to the available data) and Abstracts Views on Vision4Press platform.
Data correspond to usage on the plateform after 2015. The current usage metrics is available 48-96 hours after online publication and is updated daily on week days.
Initial download of the metrics may take a while.