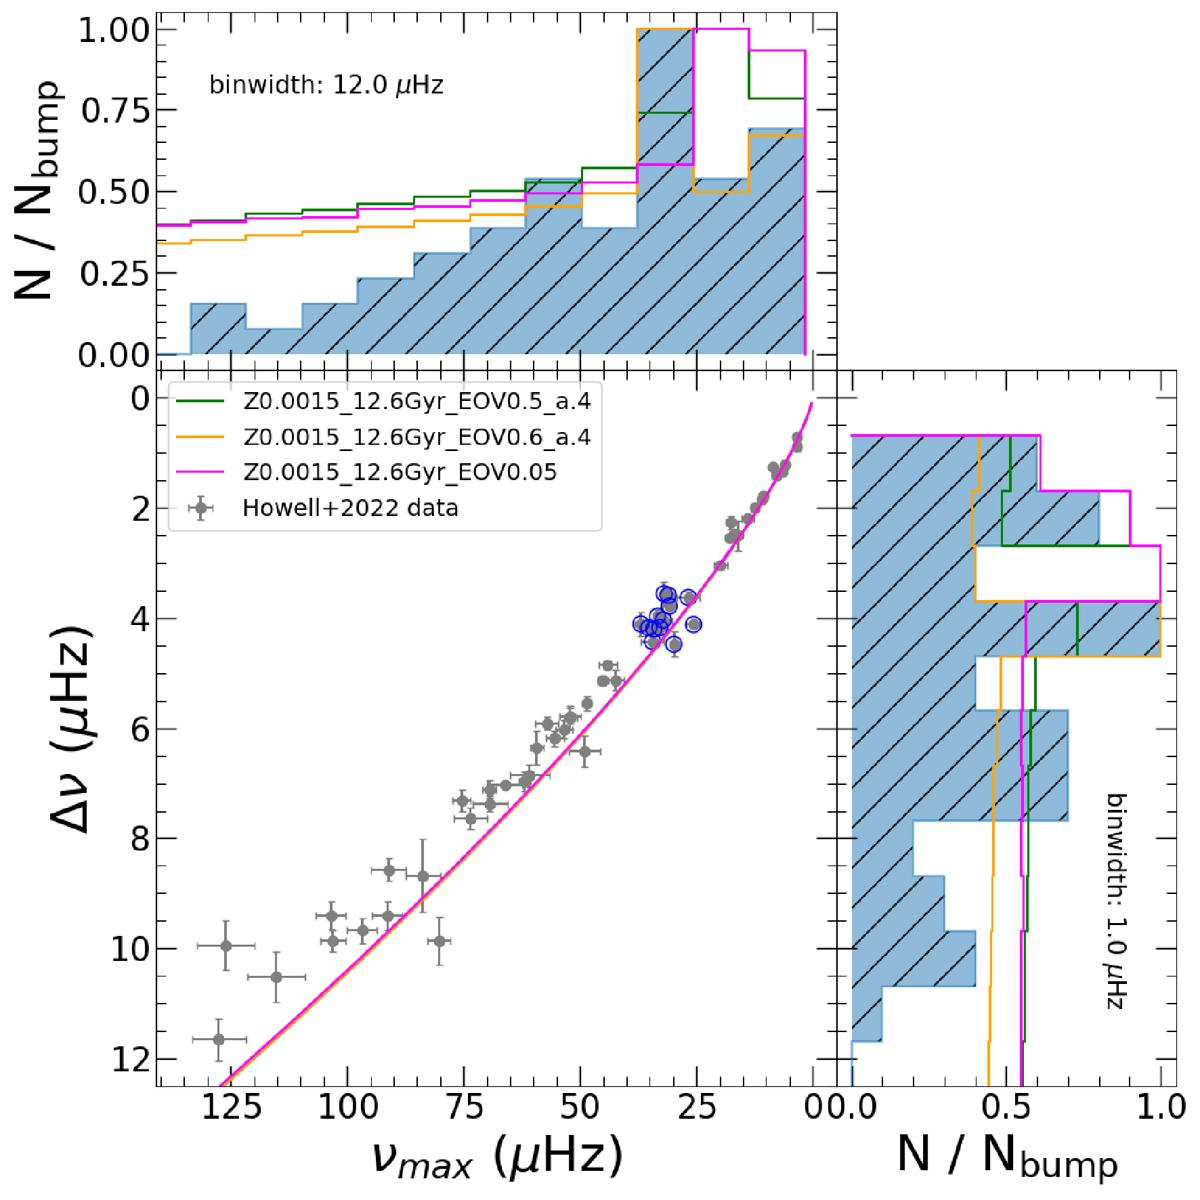
Fig. 14.
Download original image
Seismic diagram of 58 RGB stars in Howell et al. (2022). The selected isochrones with a variation of Λe = 0.05, 0.5, 0.6 are superimposed by solid lines. The distinguished excess stars in the H22 sample are circled in blue. Star count histograms on νmax and Δν are shown in the top and right panels, correspondingly, in which the blue-hatched area indicates the H22 data and the lines represent model predictions.
Current usage metrics show cumulative count of Article Views (full-text article views including HTML views, PDF and ePub downloads, according to the available data) and Abstracts Views on Vision4Press platform.
Data correspond to usage on the plateform after 2015. The current usage metrics is available 48-96 hours after online publication and is updated daily on week days.
Initial download of the metrics may take a while.