Fig. 12.
Download original image
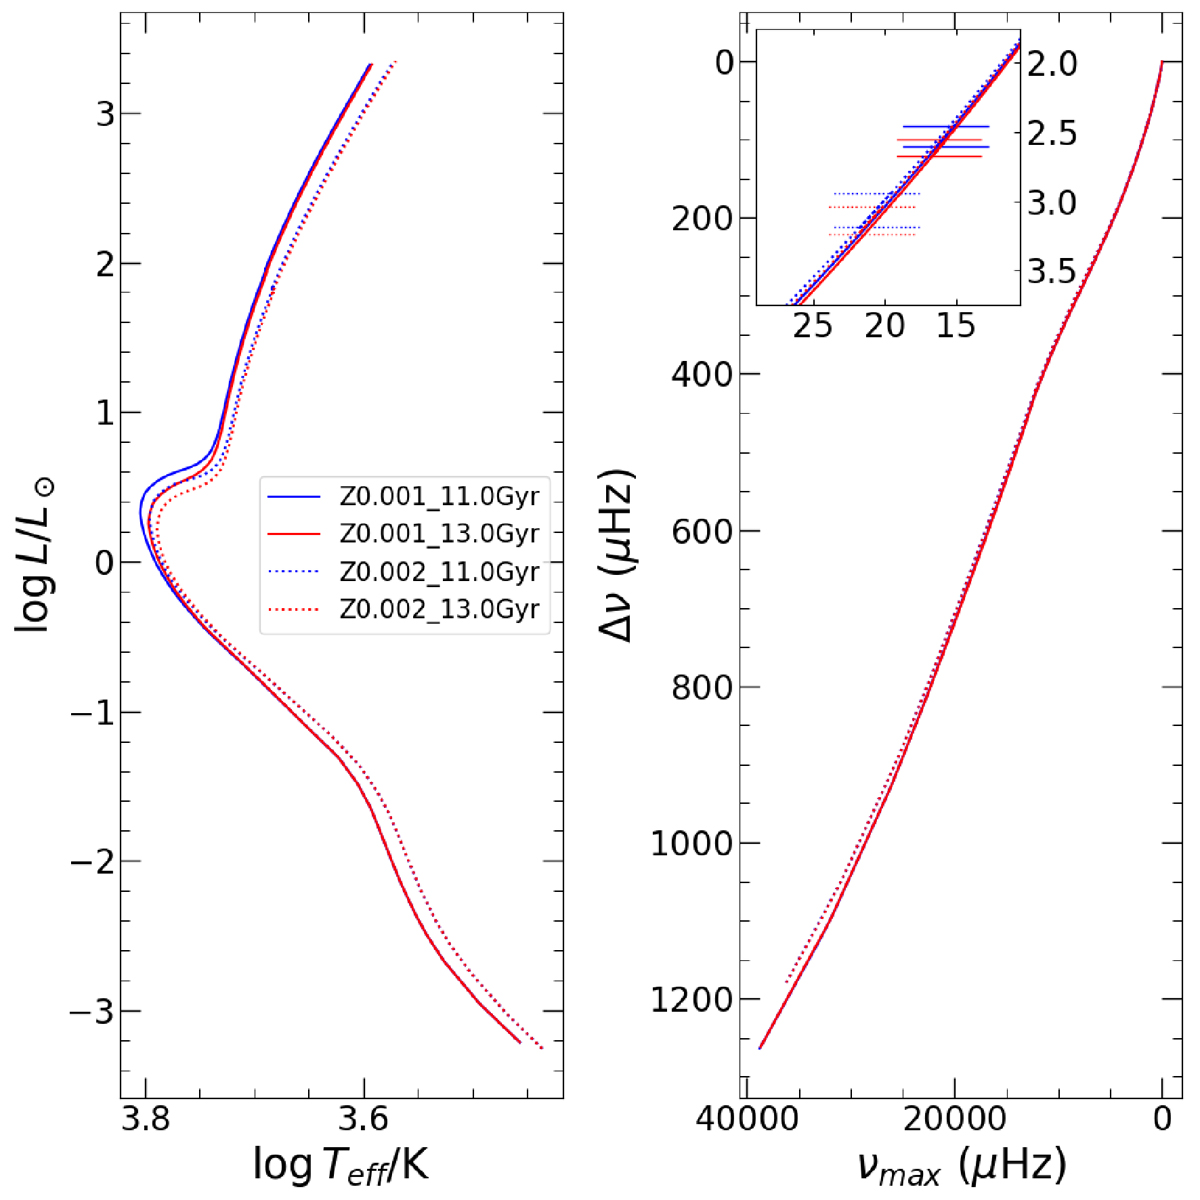
Left: Hertzsprung–Russell diagram (HRD) of four selected isochrones, with metallicity spanning from 0.001 − 0.002 and age ranges from 11 − 13 Gyr. Right: Seismic diagram corresponding to the HRD on the left side. The inset is a zoom-in of the region of the RGB bump. The horizontal bars mark the maximum and minimum of the bump.
Current usage metrics show cumulative count of Article Views (full-text article views including HTML views, PDF and ePub downloads, according to the available data) and Abstracts Views on Vision4Press platform.
Data correspond to usage on the plateform after 2015. The current usage metrics is available 48-96 hours after online publication and is updated daily on week days.
Initial download of the metrics may take a while.